Nozzle Research
Google Plays Dumb
Google has been playing dumb with rank trackers: it serves a normal page, the full query in its title, with results about one word of it. For “easy strawberry jam”, its AI Overview still gives a jam recipe, over results about the TV series Easy. It came and went from March 2026, and from September 16 it reached up to two fifths of SERPs a day, on page 1 or page 2.
This is a companion to Poisoned Google SERPs, which counts a different fault on the same SERPs: the query answered, with the keyword’s usual sites swapped out. The words on the page tell the two apart.
- SERPs analyzed
- 248M
- ignored part of the query on page 1 or 2
- 13.9%
- ignored part of the query at the peak, September 28
- 39.9%
- of these pages say “Showing results for”
- 0.0%
Key findings
- One word, not the querySince September 16, page 1 or page 2 ignored part of the query on 13.9% of the SERPs judged on both pages, against 0.06% before, and on 39.9% at the peak.
- Page 2 went firstFrom September 17 to 29, a fifth to two fifths of page 2s a day ignored part of the query, nearly all under a normal page 1.
- The page plays alongThe title still shows the full query on 99.8% of these pages, and “People also search for” follows the one word.
- It came and went from MarchBursts of up to 0.3% of SERPs a week from March; in late September, 25.0%, seventy times July’s peak.
- A one-day crash in your rankingsA tracked site misses the top 10 on 70% of these pages; 86% of the time the next SERP is normal again.
The query sent, as Google answered it
What Google answers instead
Each pair is the same keyword, device and target location, one to three days apart. Pick one, then drag the divider across the page. Google’s own panels, the AI Overview, the Ether price chart and the map, still answer the query sent. The organic results answer one word.
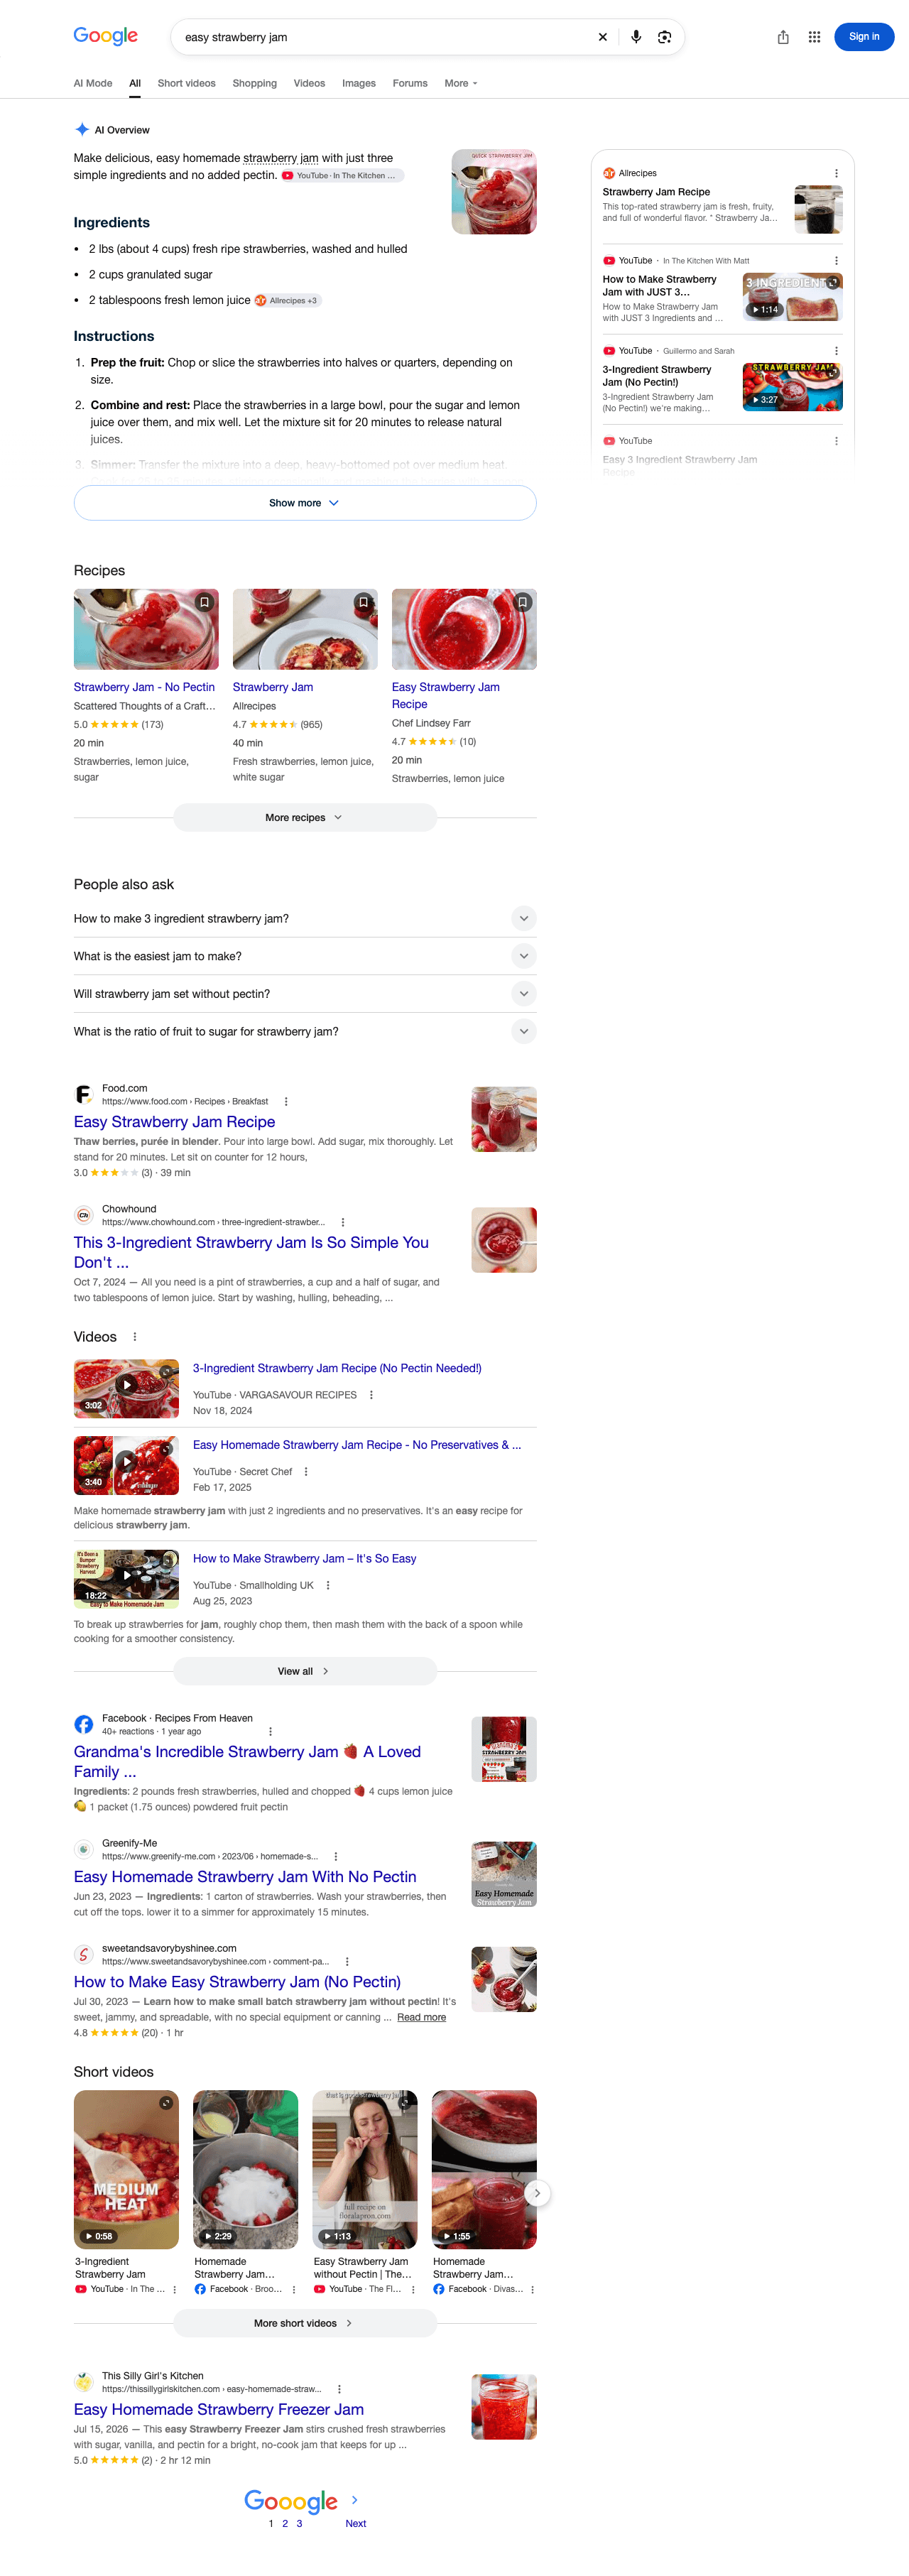
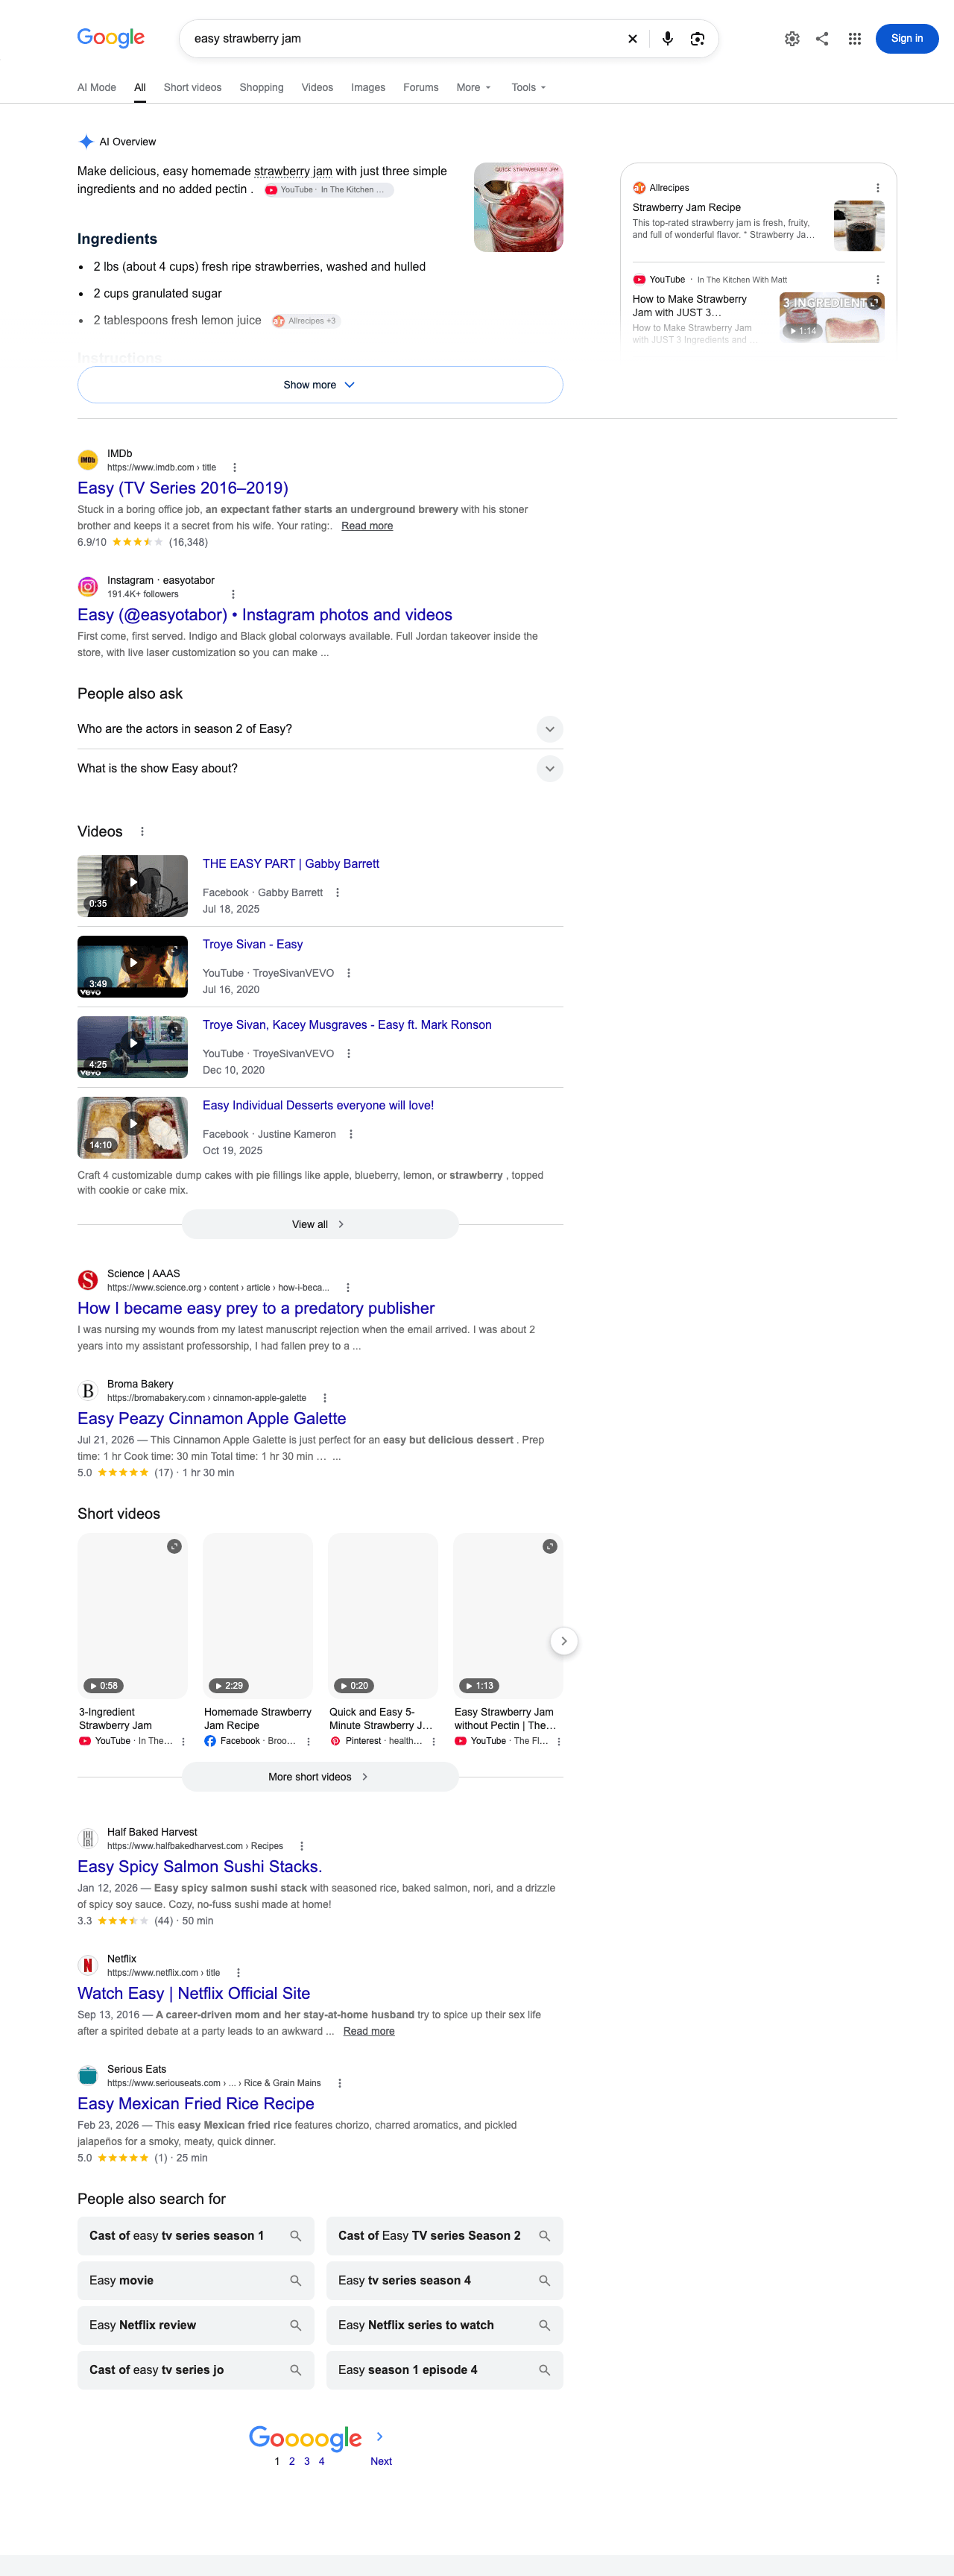
Drag the divider, or click anywhere on the page to move it there. Scroll inside the frame to move down both SERPs together.
Which word survives
Most of these pages dropped one word of the query, and on half of them one word is all the results still carry. It can be any word: the first, as in “easy strawberry jam”, one in between, as in “valentine gifts for kids”, or the last, as in “eth price”.
How many words of the query Google drops
- One word66.2%
- Two words21.6%
- Three or more12.3%
- Of 497,362 pages ignoring part of the query since Sep 16.
How many words are left on most of the results
- One word left51.5%
- Two or more left25.1%
- None on most results23.4%
- Of 497,362 pages ignoring part of the query since Sep 16.
Download the data (6 rows, one per chart and part; gzipped CSV). It holds every number in the two charts, with no account or keyword in it.
Chart table
| Chart | Part | Pages | Of | Share |
|---|---|---|---|---|
| Words dropped | One word | 329,198 | 497,362 | 66.2% |
| Words dropped | Two words | 107,204 | 497,362 | 21.6% |
| Words dropped | Three or more | 60,960 | 497,362 | 12.3% |
| Words left | One word left | 256,196 | 497,362 | 51.5% |
| Words left | Two or more left | 124,706 | 497,362 | 25.1% |
| Words left | None on most results | 116,460 | 497,362 | 23.4% |
What each column means
- chart
- dropped (how many words of the query a page dropped) or left (how many words most of its results still carry)
- item
- The part of the chart: one, two or three_or_more words dropped; one, two_or_more or none left
- pages
- Page-1 SERPs ignoring part of the query since September 16 that the part counts
- total
- Every page-1 SERP ignoring part of the query since September 16: the pages both charts count
When it hit
SerpApi’s first report of the fault came on May 4, 2026. In Nozzle’s data it starts in March, in short bursts.
Pages with one word of the query left, week by week
- Page 1 or 2
- Page 1
- Page 2
Each week’s share of judged page 1s and page 2s with one word of the query left, and in the thick line the share of SERPs judged on both pages with it on either, each keyword judged against its own previous four weeks. The axis stops at 1.5%, so the bursts can be read: page 2 and page 1 or 2 leave the chart in mid-September, and the labels give their highest weeks.
Chart table
| Week of | Page 1 or 2 | Page 1 | Page 2 |
|---|---|---|---|
| March 9, 2026 | 0.06% | 0.01% | 0.05% |
| March 16, 2026 | 0.05% | 0.01% | 0.04% |
| March 23, 2026 | 0.07% | 0.02% | 0.05% |
| March 30, 2026 | 0.11% | 0.03% | 0.08% |
| April 6, 2026 | 0.06% | 0.01% | 0.05% |
| April 13, 2026 | 0.05% | 0.01% | 0.04% |
| April 20, 2026 | 0.04% | 0.01% | 0.03% |
| April 27, 2026 | 0.04% | 0.02% | 0.03% |
| May 4, 2026 | 0.03% | 0.01% | 0.02% |
| May 11, 2026 | 0.08% | 0.03% | 0.05% |
| May 18, 2026 | 0.10% | 0.03% | 0.07% |
| May 25, 2026 | 0.08% | 0.02% | 0.05% |
| June 1, 2026 | 0.17% | 0.07% | 0.10% |
| June 8, 2026 | 0.16% | 0.07% | 0.09% |
| June 15, 2026 | 0.14% | 0.07% | 0.07% |
| June 22, 2026 | 0.07% | 0.02% | 0.04% |
| June 29, 2026 | 0.05% | 0.01% | 0.03% |
| July 6, 2026 | 0.04% | 0.01% | 0.03% |
| July 13, 2026 | 0.15% | 0.02% | 0.13% |
| July 20, 2026 | 0.35% | 0.05% | 0.30% |
| July 27, 2026 | 0.07% | 0.01% | 0.06% |
| August 3, 2026 | 0.03% | 0.01% | 0.03% |
| August 10, 2026 | 0.04% | 0.01% | 0.03% |
| August 17, 2026 | 0.03% | 0.01% | 0.02% |
| August 24, 2026 | 0.04% | 0.02% | 0.02% |
| August 31, 2026 | 0.03% | 0.01% | 0.02% |
| September 7, 2026 | 0.03% | 0.01% | 0.02% |
| September 14, 2026 | 6.7% | 0.55% | 6.5% |
| September 21, 2026 | 20.0% | 1.2% | 19.2% |
| September 28, 2026 | 25.0% | 0.84% | 24.6% |
| October 5, 2026 | 6.2% | 1.3% | 4.9% |
| October 12, 2026 | 1.5% | 0.65% | 0.66% |
| October 19, 2026 | 1.5% | 0.80% | 0.48% |
Download the data (33 rows, one per week; gzipped CSV). It holds every number in the chart as shares, with no account or keyword in it.
What each column means
- week
- The Monday that starts the week
- page1_pct
- Share of the week’s judged page 1s, in percent, with one word of the query left: a word the keyword’s results usually carry is gone from them, and exactly one word of the query is on most of them, each keyword judged against its own previous four weeks
- page2_pct
- The same share of the week’s judged page 2s
- either_pct
- Of the week’s SERPs judged on both pages, the share with one word of the query left on page 1 or page 2
Before September it came in bursts that peaked at 0.3% of SERPs a week, on page 1 or 2: late March in continental Europe, June mostly on US desktop, and the week of July 20 in every market. In the week of September 28 it was 25.0%, seventy times the July peak.
From September 16 it hit page 2 first, nearly always under a page 1 that answered the query. Page 1 followed on September 20. This chart follows both pages of the same desktop SERPs; the thick line is page 1 or 2.
Page 1 or 2 ignores part of the query
0.06% to 13.9%
SERPs ignoring part of the query on either page: baseline, then since Sep 16.
Page 1 ignores part of the query
0.02% to 2.2%
SERPs whose page 1 ignored a word of the query: baseline, then since Sep 16.
Page 2 ignores part of the query
0.05% to 12.6%
The same SERPs, with a word of the query ignored on page 2: baseline, then since Sep 16.
Under a page 1 that answers the query
93.6%
Of the SERPs ignoring part of the query on page 2 since Sep 16, the share whose page 1 answered the query sent.
SERPs ignoring part of the query, per day, by page
Thick line: SERPs ignoring part of the query on page 1 or page 2. Shaded: the baseline, Aug 20 to Sep 9. Vertical dashes: Sep 16, when page 2 first ignored part of the query, and Sep 20, when page 1 followed. Hollow points: thin days, with fewer than 25,377 SERPs (a fifth of a usual day), where a few SERPs move the line a lot; a break is a day with fewer than 100.
Daily table
| Day | SERPs | Page 1 or 2 words ignored | Page 1 words ignored | Page 2 words ignored | Both | Page 1 one word | Page 2 one word |
|---|---|---|---|---|---|---|---|
| Aug 20 | 210,675 | 0.06% | 0.01% | 0.04% | 0.0% | 0.01% | 0.01% |
| Aug 21 | 12,676 | 0.03% | 0.0% | 0.03% | 0.0% | 0.0% | 0.01% |
| Aug 22 | 5,260 | 0.06% | 0.04% | 0.02% | 0.0% | 0.02% | 0.02% |
| Aug 23 | 32,231 | 0.02% | 0.01% | 0.01% | 0.0% | 0.01% | 0.0% |
| Aug 24 | 345,427 | 0.08% | 0.02% | 0.06% | 0.00% | 0.01% | 0.02% |
| Aug 25 | 416,925 | 0.08% | 0.02% | 0.07% | 0.00% | 0.01% | 0.02% |
| Aug 26 | 361,362 | 0.05% | 0.01% | 0.04% | 0.0% | 0.01% | 0.01% |
| Aug 27 | 124,554 | 0.05% | 0.01% | 0.04% | 0.0% | 0.01% | 0.01% |
| Aug 28 | 434,356 | 0.06% | 0.01% | 0.04% | 0.00% | 0.01% | 0.01% |
| Aug 29 | 480,899 | 0.06% | 0.02% | 0.04% | 0.00% | 0.01% | 0.01% |
| Aug 30 | 409,122 | 0.07% | 0.02% | 0.05% | 0.00% | 0.01% | 0.01% |
| Aug 31 | 513,584 | 0.05% | 0.01% | 0.04% | 0.0% | 0.01% | 0.01% |
| Sep 1 | 409,389 | 0.05% | 0.02% | 0.04% | 0.00% | 0.01% | 0.01% |
| Sep 2 | 511,833 | 0.05% | 0.02% | 0.04% | 0.00% | 0.01% | 0.01% |
| Sep 3 | 376,268 | 0.07% | 0.02% | 0.06% | 0.00% | 0.01% | 0.02% |
| Sep 4 | 1,486 | 0.13% | 0.0% | 0.13% | 0.0% | 0.0% | 0.07% |
| Sep 5 | 1,414 | 0.0% | 0.0% | 0.0% | 0.0% | 0.0% | 0.0% |
| Sep 6 | 1,388 | 0.22% | 0.07% | 0.14% | 0.0% | 0.07% | 0.14% |
| Sep 7 | 1,416 | 0.0% | 0.0% | 0.0% | 0.0% | 0.0% | 0.0% |
| Sep 8 | 1,435 | 0.0% | 0.0% | 0.0% | 0.0% | 0.0% | 0.0% |
| Sep 9 | 8,231 | 0.18% | 0.01% | 0.17% | 0.0% | 0.01% | 0.01% |
| Sep 10 | 378,770 | 0.12% | 0.04% | 0.09% | 0.00% | 0.02% | 0.02% |
| Sep 11 | 0 | – | – | – | – | – | – |
| Sep 12 | 9 | – | – | – | 0.0% | – | – |
| Sep 13 | 391 | 0.0% | 0.0% | 0.0% | 0.0% | 0.0% | 0.0% |
| Sep 14 | 7,419 | 0.18% | 0.09% | 0.08% | 0.0% | 0.09% | 0.04% |
| Sep 15 | 8,540 | 0.26% | 0.11% | 0.15% | 0.0% | 0.09% | 0.06% |
| Sep 16 | 73,569 | 5.0% | 0.03% | 5.0% | 0.00% | 0.01% | 4.6% |
| Sep 17 | 44,841 | 22.7% | 0.04% | 22.7% | 0.02% | 0.03% | 20.4% |
| Sep 18 | 95,996 | 23.4% | 0.03% | 23.4% | 0.01% | 0.02% | 21.6% |
| Sep 19 | 139,254 | 20.4% | 0.04% | 20.4% | 0.02% | 0.02% | 17.9% |
| Sep 20 | 137,689 | 22.1% | 0.09% | 22.1% | 0.05% | 0.06% | 19.7% |
| Sep 21 | 64,091 | 23.8% | 0.07% | 23.7% | 0.04% | 0.04% | 20.8% |
| Sep 22 | 206,440 | 29.1% | 0.19% | 29.0% | 0.11% | 0.12% | 26.2% |
| Sep 23 | 144,442 | 28.9% | 0.44% | 28.7% | 0.23% | 0.20% | 24.8% |
| Sep 24 | 114,698 | 30.6% | 0.58% | 30.3% | 0.31% | 0.25% | 26.8% |
| Sep 25 | 147,493 | 29.0% | 1.1% | 28.4% | 0.59% | 0.41% | 24.6% |
| Sep 26 | 278,750 | 31.7% | 1.7% | 30.9% | 0.94% | 0.59% | 27.1% |
| Sep 27 | 189,106 | 36.1% | 2.6% | 35.1% | 1.5% | 0.84% | 29.8% |
| Sep 28 | 56,284 | 39.9% | 1.5% | 39.3% | 0.91% | 0.60% | 36.5% |
| Sep 29 | 142,382 | 28.5% | 2.6% | 27.2% | 1.4% | 0.81% | 21.9% |
| Sep 30 | 134,971 | 5.7% | 2.7% | 3.9% | 0.87% | 0.95% | 1.3% |
| Oct 1 | 114,953 | 4.6% | 2.1% | 3.2% | 0.67% | 0.75% | 1.1% |
| Oct 2 | 136,017 | 2.8% | 1.4% | 1.8% | 0.42% | 0.53% | 0.74% |
| Oct 3 | 107,605 | 6.8% | 3.8% | 4.3% | 1.2% | 1.3% | 1.4% |
| Oct 4 | 122,504 | 6.3% | 3.4% | 4.0% | 1.0% | 1.2% | 1.5% |
| Oct 5 | 104,042 | 7.4% | 4.1% | 4.7% | 1.4% | 1.4% | 1.5% |
| Oct 6 | 80,910 | 6.0% | 3.5% | 3.6% | 1.0% | 1.2% | 1.2% |
| Oct 7 | 158,116 | 7.3% | 4.1% | 4.7% | 1.4% | 1.3% | 1.5% |
| Oct 8 | 156,882 | 6.5% | 3.9% | 3.9% | 1.3% | 1.3% | 1.3% |
| Oct 9 | 123,980 | 7.4% | 4.9% | 4.2% | 1.7% | 1.7% | 1.4% |
| Oct 10 | 138,213 | 6.7% | 4.5% | 3.7% | 1.5% | 1.6% | 1.2% |
| Oct 11 | 122,387 | 7.5% | 5.0% | 4.2% | 1.7% | 1.7% | 1.4% |
| Oct 12 | 152,710 | 4.9% | 3.1% | 2.8% | 0.99% | 1.2% | 0.97% |
| Oct 13 | 117,814 | 6.9% | 4.6% | 4.0% | 1.7% | 1.5% | 1.3% |
| Oct 14 | 168,214 | 1.2% | 0.66% | 0.69% | 0.19% | 0.26% | 0.24% |
| Oct 15 | 147,963 | 0.89% | 0.48% | 0.55% | 0.14% | 0.21% | 0.19% |
| Oct 16 | 158,244 | 1.4% | 0.81% | 0.74% | 0.18% | 0.36% | 0.26% |
| Oct 17 | 126,885 | 3.2% | 2.1% | 1.8% | 0.66% | 0.70% | 0.60% |
| Oct 18 | 174,630 | 3.0% | 2.0% | 1.6% | 0.61% | 0.74% | 0.55% |
| Oct 19 | 103,027 | 5.1% | 3.4% | 2.9% | 1.1% | 1.2% | 0.96% |
| Oct 20 | 111,694 | 4.1% | 2.7% | 2.2% | 0.86% | 0.91% | 0.72% |
| Oct 21 | 65,436 | 7.6% | 5.1% | 4.3% | 1.8% | 1.6% | 1.4% |
Download the data (63 rows, one per day; gzipped CSV). It holds every number in the chart and the tiles, with no account or keyword in it.
What each column means
- date
- Day the SERP was scheduled, UTC
- judged
- Desktop SERPs that day with five or more organic results on each page, a query of two or more words and a keyword with five or more baseline SERPs
- page1_other_query
- Of those, sERPs whose page 1 ignores part of the query: a word of the query that at least 60% of the keyword’s baseline page-1 results carried is on at most 20% of them
- page2_other_query
- The same for page 2
- both_other_query
- SERPs ignoring part of the query on both pages; page1_other_query + page2_other_query − both_other_query is the page 1 or 2 line
- page1_one_word
- Of the SERPs ignoring part of the query on page 1, those whose results carry exactly one word of the query, on 70% of them or more
- page2_one_word
- The same for page 2
Page 1 alone covers every SERP of the study: 0.7 to 3.8% a day since September 20, against 0.02% before. The rest of the study counts page 1. Pick a country or a device.
Ignores part of the query
0.02% to 1.8%
SERPs with a word of the query dropped from their results: baseline, then every SERP since Sep 16.
One word left
51.5%
Of the SERPs ignoring part of the query since Sep 16, the share whose results carry exactly one word of it.
Worst day
3.8%
Oct 8, the highest daily share since Sep 16 on a day with enough SERPs.
Normal on the next SERP
85.8%
Of the SERPs ignoring part of the query since Sep 16, the share whose keyword’s next SERP, within three days, answered the query.
Share of SERPs ignoring part of the query, per day
Shaded: the baseline, Aug 20 to Sep 9. Dashed: Sep 16, when page 2 first ignored part of the query and the period the tiles compare begins, and Sep 20, when page 1 followed. Hollow points: thin days, with fewer than 191,540 judged SERPs in this slice (a fifth of its usual day), where a few SERPs move the line a lot.
Daily table
| Day | All SERPs | Judged SERPs |
|---|---|---|
| Aug 20 | 0.03% | 903,685 |
| Aug 21 | 0.01% | 1,097,353 |
| Aug 22 | 0.02% | 900,104 |
| Aug 23 | 0.01% | 1,060,631 |
| Aug 24 | 0.03% | 957,702 |
| Aug 25 | 0.02% | 1,052,966 |
| Aug 26 | 0.02% | 1,293,109 |
| Aug 27 | 0.01% | 1,132,347 |
| Aug 28 | 0.02% | 1,056,705 |
| Aug 29 | 0.03% | 1,152,569 |
| Aug 30 | 0.03% | 1,002,382 |
| Aug 31 | 0.02% | 1,205,684 |
| Sep 1 | 0.03% | 912,220 |
| Sep 2 | 0.03% | 1,198,440 |
| Sep 3 | 0.03% | 950,897 |
| Sep 4 | 0.01% | 1,157,679 |
| Sep 5 | 0.01% | 942,298 |
| Sep 6 | 0.01% | 1,103,389 |
| Sep 7 | 0.02% | 995,133 |
| Sep 8 | 0.02% | 1,085,699 |
| Sep 9 | 0.02% | 979,684 |
| Sep 10 | 0.04% | 1,082,600 |
| Sep 11 | 0.02% | 953,121 |
| Sep 12 | 0.03% | 1,057,942 |
| Sep 13 | 0.03% | 854,781 |
| Sep 14 | 0.14% | 690,424 |
| Sep 15 | 0.04% | 282,867 |
| Sep 16 | 0.04% | 179,089 |
| Sep 17 | 0.06% | 103,157 |
| Sep 18 | 0.07% | 224,010 |
| Sep 19 | 0.06% | 353,696 |
| Sep 20 | 2.5% | 576,353 |
| Sep 21 | 3.0% | 292,133 |
| Sep 22 | 1.0% | 531,341 |
| Sep 23 | 2.3% | 417,703 |
| Sep 24 | 3.3% | 354,437 |
| Sep 25 | 1.1% | 390,581 |
| Sep 26 | 1.6% | 616,536 |
| Sep 27 | 2.3% | 429,394 |
| Sep 28 | 1.5% | 135,630 |
| Sep 29 | 2.7% | 330,440 |
| Sep 30 | 3.0% | 1,181,853 |
| Oct 1 | 1.2% | 962,055 |
| Oct 2 | 0.75% | 1,145,805 |
| Oct 3 | 1.7% | 919,690 |
| Oct 4 | 1.4% | 1,074,493 |
| Oct 5 | 2.6% | 968,472 |
| Oct 6 | 2.5% | 1,063,421 |
| Oct 7 | 2.2% | 964,383 |
| Oct 8 | 3.8% | 1,063,071 |
| Oct 9 | 2.0% | 956,004 |
| Oct 10 | 2.0% | 1,052,944 |
| Oct 11 | 2.1% | 901,962 |
| Oct 12 | 1.5% | 1,102,492 |
| Oct 13 | 1.9% | 889,327 |
| Oct 14 | 1.2% | 1,091,955 |
| Oct 15 | 1.2% | 885,307 |
| Oct 16 | 0.74% | 1,080,945 |
| Oct 17 | 1.3% | 869,433 |
| Oct 18 | 1.4% | 1,001,524 |
| Oct 19 | 2.3% | 919,950 |
| Oct 20 | 1.7% | 1,023,214 |
| Oct 21 | 2.9% | 901,950 |
Download the data (1,890 rows, one per day, country and device; gzipped CSV). It holds every number in the chart and the tiles, with no account or keyword in it.
What each column means
- date
- Day the SERP was scheduled, UTC
- country
- Target country, ISO 3166 code; other is every country under 1% of SERPs, combined
- device
- desktop, iphone or android
- judged
- SERPs with five or more organic results, a query of two or more words, and a keyword with five or more baseline SERPs
- other_query
- Of those, SERPs ignoring part of the query: a word of the query that at least 60% of the keyword’s baseline results carried, in their titles, snippets or bolded text, is on at most 20% of them
- one_word
- Of those, SERPs whose results carry exactly one word of the query, on 70% of them or more
- followed_up
- SERPs ignoring part of the query followed by another judged SERP of the keyword within three days
- back
- Of those, SERPs whose next SERP answered the query sent
The device barely matters.
What else plays dumb
The organic results are not the only part that plays dumb. On the normal SERP for “trailer lock reviews”, “People also ask” asks “What is the most effective trailer lock?”. On the page answered as “reviews”, it asks “Can I trust product reviews?”.
People also ask
Share of its questions
About the full query
Only about the one word left
436,111 questions on 109,588 normal SERPs, and 421,165 on the pages with one word left that followed them. The rest have neither: 23.1% and 24.6%.
People also search for
Share of its suggested searches
About the full query
Only about the one word left
826,224 suggested searches on 113,143 normal SERPs, and 827,809 on the pages with one word left that followed them. The rest have neither: 19.8% and 23.9%.
Download the data (4 rows, two per part; gzipped CSV). It holds every number in the chart as counts of items, with no account or keyword in it.
What each column means
- part
- The part of the page: People also ask, its questions, or People also search for, its suggested searches
- serp
- normal, the keyword’s previous SERP, 48 hours or less before, that answered the query and was not poisoned; or other_query, the page-1 SERP after it with one word left, since September 16
- pairs
- Pairs of the two SERPs that both show the part
- items
- The distinct questions or searches the part showed on those SERPs, every pair together
- query_items
- Items about the full query: with a word the organic results dropped on the page ignoring part of the query
- one_word_items
- Items only about the one word left: with the word left on that page and none of the dropped ones
- neither_items
- Items with neither
“People also search for” follows the one word most: “eth price” goes from suggesting “ETH price prediction” to “Price HVAC”. Google’s own panels mostly hold: shopping, the image pack, the knowledge panel and the map keep nearly as much of the keyword’s previous SERP as normal pages do, while the organic results keep 18.5% of its sites.
What each part of the page keeps from the keyword’s previous SERP
- Baseline, Aug 20 to Sep 9
- Pages ignoring part of the query
Keeps less on pages ignoring part of the query
- Organic results90.0% → 18.5%
- People also search for89.2% → 26.4%
- People also ask87.1% → 25.0%
- AI Overview sources72.0% → 52.4%
- Discussions and forums92.5% → 75.7%
- Local pack87.1% → 71.3%
- Video81.5% → 69.4%
- Knowledge panel87.2% → 77.2%
- Image pack90.6% → 81.9%
- Shopping91.7% → 88.6%
Keeps more on pages ignoring part of the query
- Ads74.5% → 88.4%
Of the sites, questions, searches or businesses a part showed on the keyword’s previous SERP that answered the query, 48 hours or less before, the share it shows again, where both SERPs show that part. Each keyword’s pages ignoring part of the query against its own baseline, each keyword weighted by its count of them.
Part table
| Part | Kept from the previous SERP | Shown on | ||||
|---|---|---|---|---|---|---|
| Baseline | Words ignored | Normal since Sep 16 | Baseline | Words ignored | Normal since Sep 16 | |
| Organic results | 90.0% | 18.5% | 74.8% | 100.0% | 100.0% | 100.0% |
| People also search for | 89.2% | 26.4% | 78.1% | 81.1% | 61.7% | 76.5% |
| People also ask | 87.1% | 25.0% | 68.4% | 76.8% | 63.5% | 73.3% |
| AI Overview sources | 72.0% | 52.4% | 66.5% | 55.8% | 62.0% | 64.4% |
| Discussions and forums | 92.5% | 75.7% | 90.3% | 18.4% | 17.3% | 18.7% |
| Local pack | 87.1% | 71.3% | 69.6% | 28.1% | 30.9% | 29.7% |
| Video | 81.5% | 69.4% | 80.1% | 19.5% | 24.1% | 20.3% |
| Knowledge panel | 87.2% | 77.2% | 80.1% | 5.4% | 6.9% | 7.3% |
| Image pack | 90.6% | 81.9% | 83.6% | 27.0% | 31.4% | 28.3% |
| Shopping | 91.7% | 88.6% | 94.2% | 9.6% | 9.6% | 10.0% |
| Ads | 74.5% | 88.4% | 80.9% | 9.0% | 9.8% | 7.1% |
Download the data (11 rows, one per part of the page; gzipped CSV). It holds every number in the chart and the table, with no account or keyword in it.
What each column means
- part
- The part of the page
- kept_baseline_pct
- Of the sites, questions, searches or businesses the part showed on the keyword’s previous SERP that answered the query, the share it shows again, where both SERPs show the part: baseline SERPs, August 20 to September 9
- kept_other_query_pct
- The same for pages ignoring part of the query since September 16, 2026, each against the keyword’s previous SERP that answered the query
- kept_normal_pct
- The same for the same keywords’ SERPs since September 16, 2026 that answer the query
- shown_baseline_pct
- Share of baseline SERPs showing the part
- shown_other_query_pct
- Share of pages ignoring part of the query showing the part
- shown_normal_pct
- Share of the same keywords’ SERPs since September 16, 2026 that answer the query showing the part
Countries, searches and industries
Two thirds of the study’s datasets had at least one page ignoring part of the query. Belgium ran highest, Japan lowest.
Share of SERPs ignoring part of the query since Sep 16, by target country
- Under 1%
- 1–1.5%
- 1.5–2%
- 2–3%
- 3% or more
- Not enough data
A country needs 10 datasets and 10,000 judged SERPs to be coloured. Hong Kong and Singapore are too small to draw at this scale and show as a dot.
Country table
| Country | Ignores part of the query | Judged SERPs |
|---|---|---|
| Belgium | 4.8% | 316,062 |
| Thailand | 4.0% | 20,370 |
| New Zealand | 2.7% | 178,521 |
| Norway | 2.6% | 34,458 |
| Austria | 2.5% | 76,304 |
| Mexico | 2.5% | 210,463 |
| Portugal | 2.4% | 197,077 |
| Switzerland | 2.3% | 66,949 |
| Argentina | 2.2% | 55,333 |
| Bulgaria | 2.2% | 24,195 |
| United States | 2.1% | 16,765,307 |
| Netherlands | 2.0% | 271,887 |
| Romania | 1.9% | 24,479 |
| Poland | 1.8% | 66,950 |
| Sweden | 1.8% | 48,955 |
| Australia | 1.7% | 475,621 |
| Israel | 1.7% | 23,909 |
| Saudi Arabia | 1.7% | 44,327 |
| South Africa | 1.7% | 65,579 |
| Spain | 1.7% | 742,946 |
| Brazil | 1.6% | 126,906 |
| Singapore | 1.6% | 65,500 |
| United Arab Emirates | 1.6% | 48,455 |
| Chile | 1.5% | 30,359 |
| Taiwan | 1.5% | 13,800 |
| Canada | 1.4% | 1,975,943 |
| Colombia | 1.4% | 16,423 |
| Germany | 1.4% | 555,326 |
| India | 1.4% | 225,060 |
| South Korea | 1.4% | 14,174 |
| Finland | 1.3% | 32,032 |
| Indonesia | 1.3% | 20,281 |
| Italy | 1.3% | 254,563 |
| Türkiye | 1.3% | 39,191 |
| Ukraine | 1.3% | 16,106 |
| France | 1.2% | 596,558 |
| Greece | 1.2% | 42,087 |
| Ireland | 1.2% | 89,263 |
| Malaysia | 1.2% | 17,703 |
| Peru | 1.0% | 22,124 |
| Hong Kong | 0.9% | 18,147 |
| United Kingdom | 0.8% | 2,590,408 |
| Vietnam | 0.8% | 19,064 |
| Japan | 0.6% | 173,089 |
Download the data (44 rows, one per country; gzipped CSV). It holds every number on the map, with no account or keyword in it.
What each column means
- country
- Target country, ISO 3166 code
- judged
- SERPs with five or more organic results, a query of two or more words, and a keyword with five or more baseline SERPs, since September 16, 2026
- other_query
- Of those, SERPs ignoring part of the query: a word that at least 60% of the keyword’s baseline results carried is on at most 20% of them
- Longer queries more. 0.9% of two-word queries, 3.2% of five words or more.
- The long tail more. 2.1% under 100 searches a month, 0.5% at 100,000 or more.
- “Near me” and postal codes less. 1.4% and 1.1%, against 1.8% overall.
Each ridge is one industry’s US page 1s, day by day; the grey ridge is every US SERP.
Share of US SERPs ignoring part of the query per day, by industry
Every ridge is on one scale: the tallest, events and entertainment SERPs on Sep 29, is 7.1%. Grey: every judged US SERP. Shaded: the baseline. Dashed: Sep 16, when page 2 first ignored part of the query, and Sep 20, when page 1 followed. The numbers are the share since Sep 16, or on the day you point at.
Industry table
| Industry | Since Sep 16 | Worst day | Judged SERPs |
|---|---|---|---|
| Events and entertainment | 3.0% | 7.1%, Sep 29 | 88,235 |
| Real estate | 2.6% | 5.9%, Sep 29 | 4,843,927 |
| All US SERPs | 2.1% | 4.0%, Oct 8 | 16,765,307 |
| Travel and hospitality | 2.1% | 4.1%, Oct 8 | 225,819 |
| Software and technology | 1.9% | 4.4%, Oct 8 | 257,666 |
| Telecom and internet | 1.9% | 4.0%, Oct 8 | 1,568,874 |
| Transportation | 1.9% | 4.5%, Oct 8 | 292,471 |
| Jobs and careers | 1.8% | 4.0%, Sep 29 | 277,528 |
| Health and medical | 1.7% | 3.9%, Sep 24 | 233,238 |
| Home services | 1.7% | 4.1%, Sep 24 | 202,909 |
| Legal | 1.7% | 5.1%, Sep 24 | 48,538 |
| Finance and banking | 1.6% | 4.2%, Sep 24 | 273,934 |
| Pets | 1.6% | 4.6%, Sep 29 | 33,364 |
| Restaurants and food | 1.6% | 4.4%, Sep 24 | 248,162 |
| Retail and shopping | 1.6% | 3.6%, Sep 21 | 2,193,597 |
| Education | 1.5% | 4.5%, Sep 24 | 53,248 |
| Insurance | 1.5% | 6.0%, Sep 21 | 87,467 |
| Weddings | 1.5% | 5.1%, Sep 28 | 28,026 |
| Automotive | 1.2% | 4.4%, Oct 6 | 536,182 |
| Beauty and fashion | 1.1% | 3.2%, Oct 8 | 94,018 |
| Home and garden | 1.1% | 3.5%, Sep 20 | 599,730 |
Download the data (1,323 rows, one per day and industry; gzipped CSV). It holds every number in the chart, with no account or keyword in it.
What each column means
- date
- Day the SERP was scheduled, UTC
- industry
- The keyword’s industry, or Unclassified
- judged
- US SERPs that day with five or more organic results, a query of two or more words and a keyword with five or more baseline SERPs
- other_query
- Of those, SERPs ignoring part of the query: a word that at least 60% of the keyword’s baseline results carried is on at most 20% of them
What it does to rankings
Where a project’s own site is one of the keyword’s usual sites, it was out of the top 10 on 69.8% of these pages, against 2.0% in the baseline. Then it passes: nine spells in ten last one SERP, and the keyword’s next SERP within three days answered the query again 85.8% of the time. A site that “lost” a keyword for a day most likely had its query answered for one word.
How to spot it
- The title says the full query. On 99.8% of these pages, with no “Showing results for”.
- Every result is about one word. A ranking change moves sites. It doesn’t change what the results are about.
- It wears poisoning’s marks. On desktop keywords that usually run to page 8, pagination stops by page 4 on 43.0% of these pages, against 0.2% normally, and one domain fills three spots or more on 32.2%, against 10.0%.
- More than half also fail the poisoning test. 54.0% lose most of the keyword’s usual sites too. The words decide which fault it is.
- It is older. It came and went from March (When it hit), and SerpApi has tracked it since May.
Method
- SERPs. A representative sample of the SERPs Nozzle tracks for its customers, the poisoned study’s datasets: 47 countries, desktop, iPhone and Android, from March 9 to October 21, 2026. A smaller sample of them back to October 2025 never passes 0.07% of page 2s a week before March.
- Judged. A query of two words or more besides stop words, five organic results or more, and five earlier SERPs of the keyword to compare with. Only judged SERPs are counted: 253 million in all, 248 million since March 9, 54.0 million from August 20 and 27.0 million since September 16.
- The test. A word is usual when 60% of the keyword’s results carry it, in titles, snippets or Google’s bolding. A page ignores part of the query when a usual word is on 20% of its results or fewer, and has one word left when exactly one query word is on 70% or more. The history compares each keyword with its previous four weeks; every other chart with its SERPs from August 20 to September 9.
- Page 1 or 2. A SERP counts once when either page ignores part of the query, of the SERPs judged on both pages: 4.7 million desktop SERPs since September 16.
- Questions and suggestions. Compared with the keyword’s normal SERP before, 48 hours or less earlier. One counts as about the full query when it has a word the results dropped.
- Examples. Picked because they show plainly which words went. Each renders Nozzle’s stored page-1 HTML in Chrome with Google’s scripts blocked. The sites are Google’s results, not Nozzle customers.