Nozzle Research
Poisoned Google SERPs
Since September 2026, Google has been poisoning the SERPs it serves rank trackers: complete, normal-looking pages whose results have been swapped out. Nothing on the page gives it away. Each keyword’s own history does.
- SERPs analyzed
- 27.5M
- keywords with poisoned SERPs
- 660K+
- countries
- 49
- of SERPs poisoned
- 8.0%
Key findings
- 8.0% of SERPs came back poisonedSince September 13, against 0.17% before. On the worst days, September 27 to 29, it was a quarter of all SERPs.
- Blocked first, then poisonedRequests to Google started failing on September 13; from September 20, the ones that got through came back poisoned. It is Google’s response to AI scraping, and rank trackers are caught in it.
- The page looks normal. The results don’t.No error, no captcha, the same template, but most of the keyword’s usual sites are gone: the organic results keep 20.7% of the previous SERP’s sites, against 88.5% before.
- Social sites and forums fill the gapReddit, Facebook, LinkedIn, Instagram and Quora show up more often; YouTube, Yelp and MapQuest less.
- Tracked sites fall out of the top 10A project’s own site misses the top 10 on 58.6% of poisoned SERPs, against 2.7% before.
- It passes within days77.9% of poisoned SERPs have their usual sites back within three days. A one-day drop in late September is more likely this than a ranking change.

The search “white label local seo” loads page 1, and three days later every site on it has been replaced, with nothing on the page to say so; a rank report reads it as a crash. The film then follows the study: 27.5 million SERPs, requests to Google failing from September 13 and poisoned SERPs from September 20, why a poisoned SERP is worse than a blocked request, the social sites and forums that take the usual sites’ place, tracked sites falling out of the top 10, and how quickly it passes.
What it looks like
Each pair below is the same keyword, device and target location, collected one to three days apart. Pick one, then drag the divider across the page.
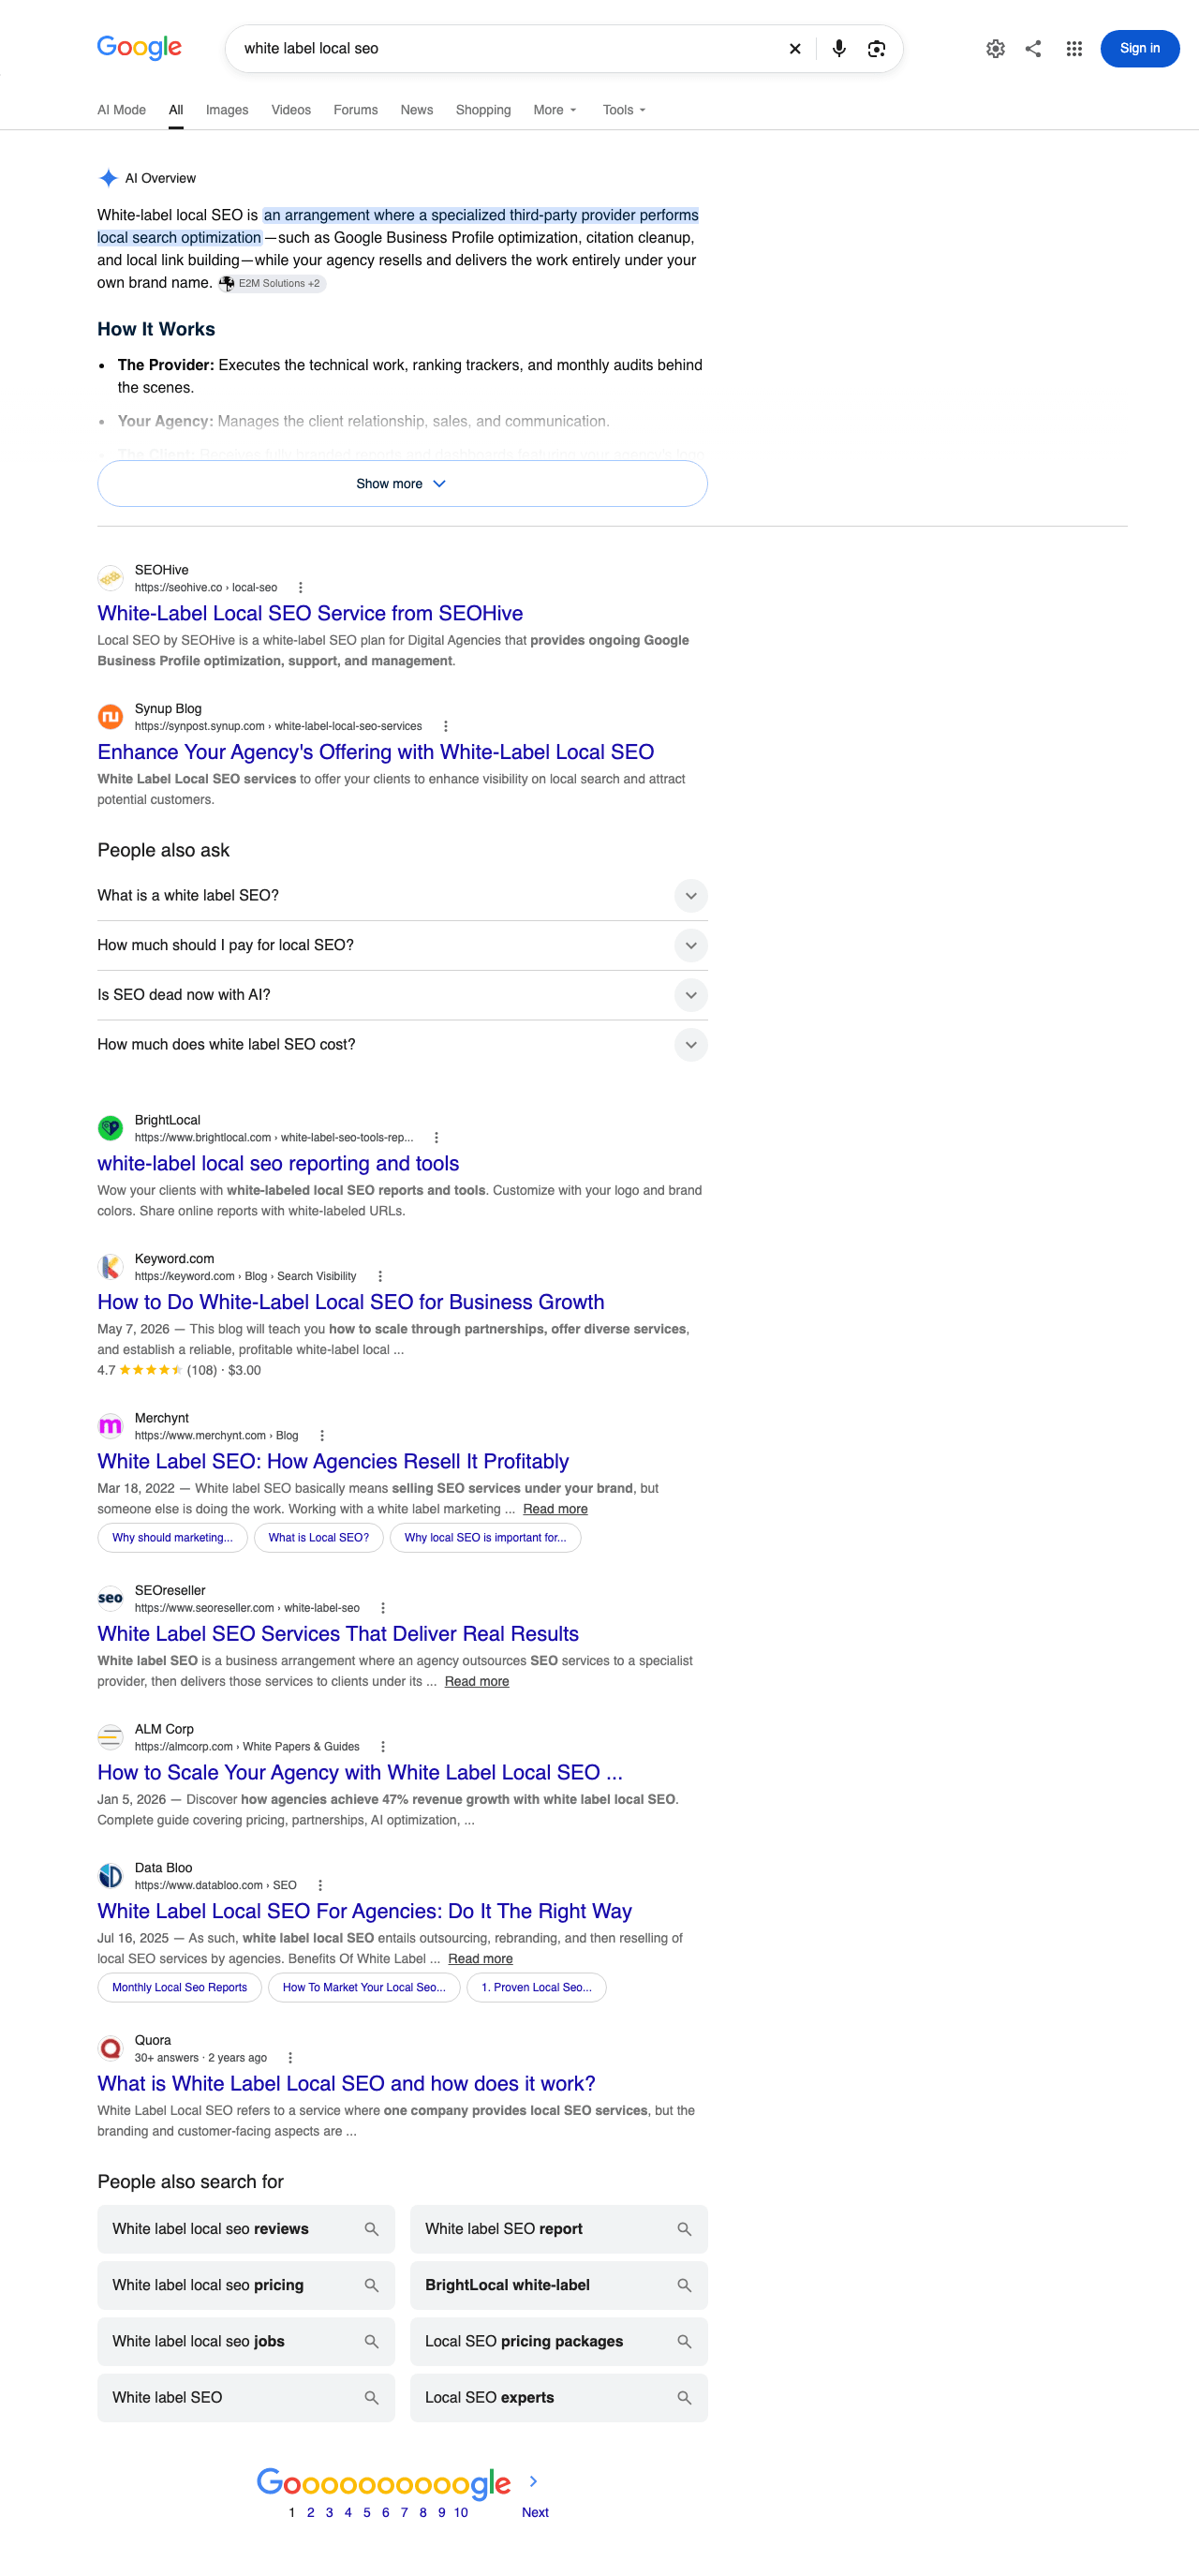
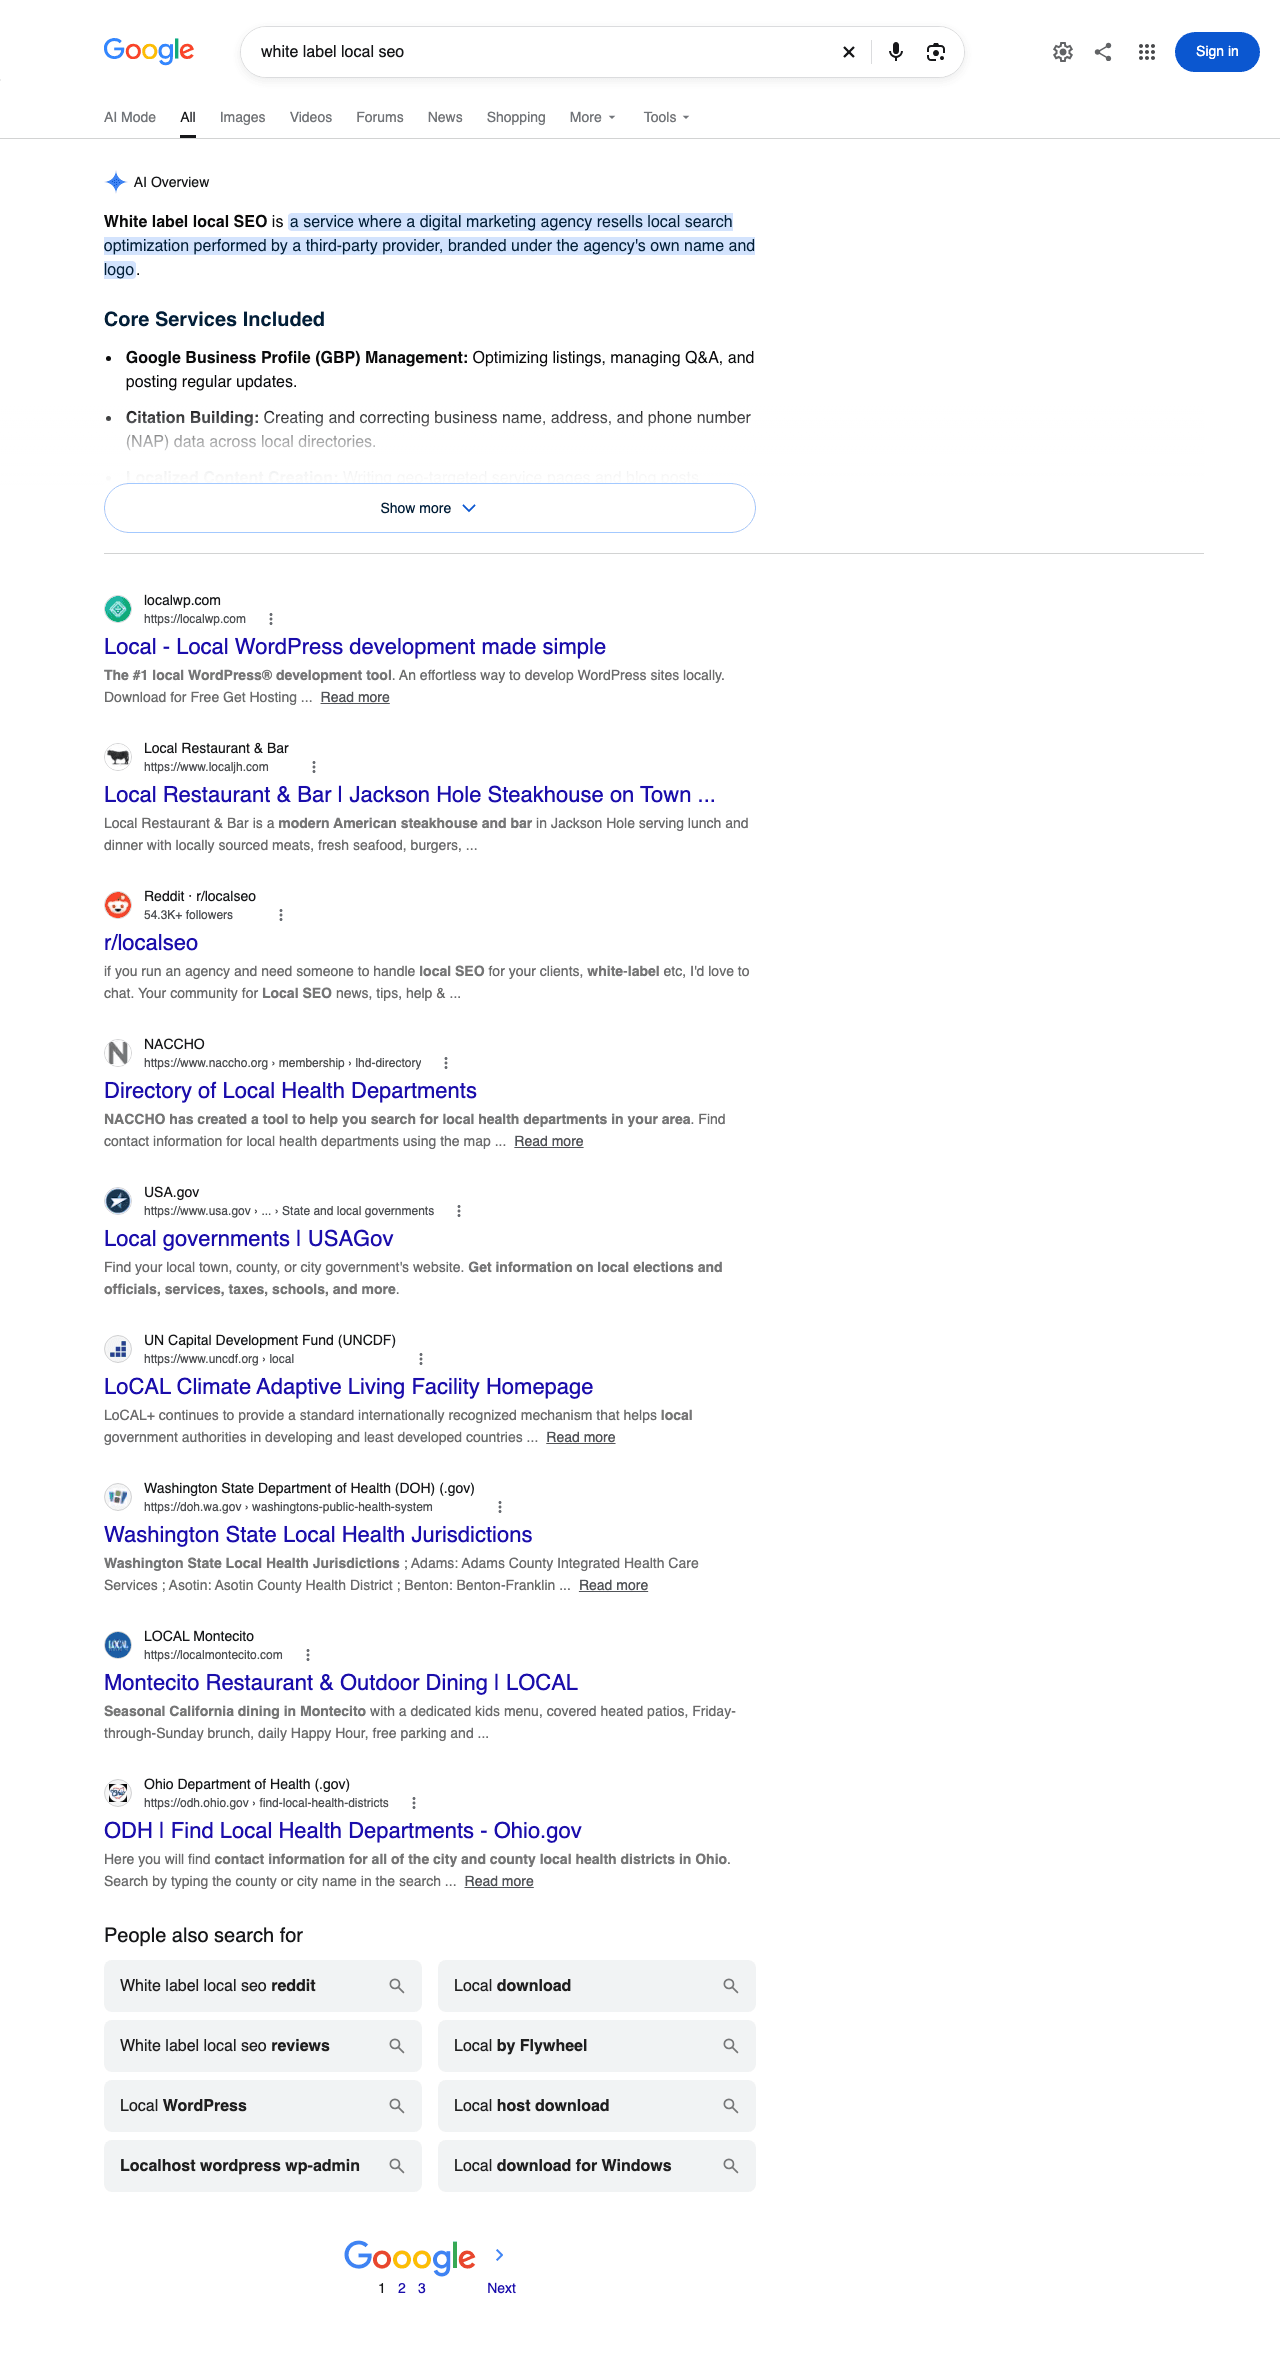
Drag the divider, or click anywhere on the page to move it there. Scroll inside the frame to move down both SERPs together.
By the numbers
A SERP is poisoned when fewer than half of its keyword’s usual sites appear anywhere on it, and they come back on a later SERP. A keyword’s usual sites are the ones in its top 10 on at least 60% of its SERPs from August 20 to September 9.
The SERPs come from a representative cross-section of the datasets Nozzle collects for its customers: 49 countries, desktop, iPhone and Android, and targeting from whole countries down to postal codes. Four in five of those datasets had at least one poisoned SERP.
On September 13, requests to Google started failing in large numbers, and for two weeks fewer SERPs came through. The ones that did were normal until September 20, when poisoned SERPs first appear. They reached a quarter of all SERPs from September 27 to 29, and have run at about 5 to 11% a day since October 1.
That sequence is why we call it poisoning. Google is not refusing these requests; it answers them with a complete page whose results are wrong, and nothing on the page says so. A refused request tells a scraper to try again, while a poisoned one gets stored as real. It is Google’s response to AI scraping and grounding, the bulk collection of its results to feed AI answers, and rank trackers, which collect SERPs the same way, are caught in it.
Poisoned SERPs
0.17% to 8.0%
Baseline, then every SERP since Sep 13. Daily since then: 0–27%.
Sites gone per SERP
0.23 to 1.79
Of the previous SERP’s top 10, baseline then since Sep 13.
Short pagination
0.19% to 32.5%
Desktop SERPs whose page numbers stop at 4 or earlier, on keywords that usually run to page 8: baseline, then the worst day, Sep 28.
Back within three days
77.9%
Of the poisoned SERPs since Sep 13, the share whose keyword had its usual sites back within three days.
Share of SERPs missing most of the keyword’s usual sites, per day
Shaded: the baseline, Aug 20 to Sep 9. Dashed: Sep 13, when requests to Google started failing and the period the tiles compare begins, and Sep 20, when poisoned SERPs first appear. Hollow points: thin days, with fewer than 198,646 SERPs in this slice (a fifth of its usual day), where a few SERPs move the line a lot. A SERP counts as poisoned once its keyword’s usual sites come back, so the last three days are still filling in.
Daily table
| Day | All SERPs | SERPs |
|---|---|---|
| Aug 20 | 0.06% | 937,095 |
| Aug 21 | 0.12% | 1,137,704 |
| Aug 22 | 0.12% | 933,999 |
| Aug 23 | 0.11% | 1,097,483 |
| Aug 24 | 0.05% | 993,230 |
| Aug 25 | 0.05% | 1,089,001 |
| Aug 26 | 0.45% | 1,324,350 |
| Aug 27 | 1.2% | 1,146,448 |
| Aug 28 | 0.04% | 1,100,991 |
| Aug 29 | 0.04% | 1,197,012 |
| Aug 30 | 0.04% | 1,043,040 |
| Aug 31 | 0.04% | 1,252,272 |
| Sep 1 | 0.05% | 948,502 |
| Sep 2 | 0.07% | 1,241,572 |
| Sep 3 | 0.04% | 987,715 |
| Sep 4 | 0.12% | 1,200,368 |
| Sep 5 | 0.12% | 978,110 |
| Sep 6 | 0.15% | 1,142,666 |
| Sep 7 | 0.16% | 1,034,224 |
| Sep 8 | 0.20% | 1,125,779 |
| Sep 9 | 0.18% | 1,018,813 |
| Sep 10 | 0.15% | 1,121,881 |
| Sep 11 | 0.12% | 991,655 |
| Sep 12 | 0.17% | 1,098,064 |
| Sep 13 | 0.17% | 888,364 |
| Sep 14 | 0.31% | 718,036 |
| Sep 15 | 0.16% | 294,126 |
| Sep 16 | 0.07% | 187,238 |
| Sep 17 | 0.15% | 109,952 |
| Sep 18 | 0.15% | 234,441 |
| Sep 19 | 0.13% | 367,975 |
| Sep 20 | 1.9% | 597,749 |
| Sep 21 | 2.3% | 303,965 |
| Sep 22 | 1.5% | 550,114 |
| Sep 23 | 3.9% | 433,705 |
| Sep 24 | 6.1% | 367,449 |
| Sep 25 | 11.1% | 406,244 |
| Sep 26 | 18.4% | 645,700 |
| Sep 27 | 24.9% | 448,890 |
| Sep 28 | 26.7% | 146,156 |
| Sep 29 | 27.0% | 344,855 |
| Sep 30 | 12.7% | 1,233,742 |
| Oct 1 | 8.0% | 1,004,109 |
| Oct 2 | 4.9% | 1,196,122 |
| Oct 3 | 10.2% | 957,652 |
| Oct 4 | 8.6% | 1,117,691 |
| Oct 5 | 10.5% | 1,009,781 |
| Oct 6 | 9.5% | 1,107,417 |
| Oct 7 | 11.4% | 1,002,183 |
| Oct 8 | 7.2% | 1,101,965 |
| Oct 9 | 4.2% | 992,346 |
Download the data (1,377 rows, one per day, country and device; gzipped CSV). It holds every number in the chart and the tiles, with no account, keyword or provider in it.
What each column means
- date
- Day the SERP was scheduled, UTC
- country
- Target country, ISO 3166 code; other is every country under 1% of SERPs, combined
- device
- desktop, iphone or android
- serps
- SERPs that day
- judged
- SERPs whose keyword has usual sites: in its top 10 on at least 60% of five or more baseline SERPs
- degraded
- Poisoned SERPs: judged SERPs with fewer than half of the usual sites on any page, which came back on a later SERP
- with_previous
- SERPs with a SERP of the same keyword in the 48 hours before
- previous_top10_missing
- Sum over those SERPs of the previous SERP’s top-10 sites gone from every page
- deep_desktop
- Desktop SERPs of keywords whose baseline pagination ran to page 8 or beyond
- short_pagination
- Of those, SERPs whose page-1 pagination stops at page 4 or earlier, or shows none
- degraded_followed_up
- Poisoned SERPs followed by another SERP of the keyword within three days
- degraded_back_3d
- Of those, SERPs whose keyword had at least 80% of its usual sites back within three days
Since September 13, 8.0% of SERPs were poisoned, against 0.17% in the baseline. Of the markets in the chart, Australia (11.5%), India (10.9%) and Canada (10.5%) ran highest, the United States at 8.5%, and Germany, France and Spain at 3.4 to 4.3%, with the United Kingdom lowest at 3.0%. The device barely matters: 7.7% on desktop, 8.3% on iPhone and 7.1% on Android. A SERP counts as poisoned once its keyword’s usual sites come back, so the last days of the chart are still filling in.
What takes their place
Social platforms and forums. Each keyword’s poisoned SERPs against its own other SERPs since September 13: how often a site is in the top 10.
Share of SERPs with the site in the top 10
- The same keywords’ other SERPs
- Poisoned SERPs
More often on poisoned SERPs
- reddit.com20.8% → 28.8%
- facebook.com28.3% → 33.8%
- linkedin.com6.2% → 9.3%
- instagram.com9.6% → 12.1%
- quora.com5.3% → 6.7%
- etsy.com2.0% → 3.0%
- justanswer.com1.9% → 2.8%
- tiktok.com1.2% → 1.9%
Less often on poisoned SERPs
- mapquest.com4.2% → 3.5%
- yelp.com12.9% → 11.1%
- youtube.com16.3% → 13.9%
Since Sep 13, each keyword’s poisoned SERPs against its own other SERPs, and each keyword weighted by its poisoned SERPs, so the comparison is not decided by which keywords are poisoned most.
Site table
| Site | Poisoned SERPs | Other SERPs | Change |
|---|---|---|---|
| reddit.com | 28.8% | 20.8% | +8.0 pts |
| facebook.com | 33.8% | 28.3% | +5.5 pts |
| linkedin.com | 9.3% | 6.2% | +3.1 pts |
| instagram.com | 12.1% | 9.6% | +2.5 pts |
| quora.com | 6.7% | 5.3% | +1.4 pts |
| etsy.com | 3.0% | 2.0% | +1.0 pts |
| justanswer.com | 2.8% | 1.9% | +0.9 pts |
| tiktok.com | 1.9% | 1.2% | +0.7 pts |
| mapquest.com | 3.5% | 4.2% | −0.7 pts |
| yelp.com | 11.1% | 12.9% | −1.8 pts |
| youtube.com | 13.9% | 16.3% | −2.4 pts |
Download the data (11 rows, one per site; gzipped CSV). It holds every number in the chart, with no account, keyword or provider in it.
What each column means
- site
- The site, by registrable domain
- degraded_pct
- Share of poisoned SERPs since September 13 with the site in the top 10, each keyword weighted by its poisoned SERPs
- other_pct
- The same share on the same keywords’ other SERPs in the period, weighted the same way
Reddit gains the most, 8.0 points, while YouTube, Yelp and MapQuest lose ground. Three or more social sites share the top 10 of 7.2% of poisoned SERPs, against 2.7% of the others, and on US keywords 14.2% of poisoned SERPs have a foreign country-code site, such as a .ca or .co.uk, in the top 10, against 6.1%.
Where it hit
The share of SERPs poisoned since September 13 in each country with at least 10 datasets and 10,000 judged SERPs. Hover a country for its number, or open the table.
Share of SERPs poisoned since Sep 13, by target country
- Under 5%
- 5–8%
- 8–10%
- 10–12%
- 12% or more
- Not enough data
A country needs 10 datasets and 10,000 judged SERPs to be coloured. Hong Kong and Singapore are too small to draw at this scale and show as a dot.
Country table
| Country | Poisoned SERPs | Judged SERPs |
|---|---|---|
| Austria | 18.8% | 70,930 |
| South Africa | 18.4% | 41,191 |
| United Arab Emirates | 14.4% | 34,503 |
| New Zealand | 13.8% | 120,619 |
| Belgium | 13.2% | 201,063 |
| Norway | 13.1% | 36,209 |
| Saudi Arabia | 12.9% | 30,952 |
| Switzerland | 12.8% | 53,088 |
| Ukraine | 11.9% | 10,413 |
| Thailand | 11.8% | 15,097 |
| Australia | 11.5% | 314,002 |
| Colombia | 11.5% | 12,310 |
| Bulgaria | 11.4% | 17,382 |
| Singapore | 11.3% | 54,383 |
| India | 10.9% | 154,990 |
| Canada | 10.5% | 1,287,409 |
| Peru | 10.3% | 14,462 |
| Romania | 10.3% | 19,350 |
| Türkiye | 10.2% | 27,491 |
| Finland | 10.1% | 31,050 |
| Mexico | 9.9% | 131,639 |
| Sweden | 9.8% | 38,908 |
| Brazil | 9.6% | 86,288 |
| Chile | 9.6% | 20,147 |
| Hong Kong | 9.4% | 34,374 |
| Argentina | 9.2% | 34,496 |
| Greece | 8.9% | 29,758 |
| South Korea | 8.9% | 13,627 |
| United States | 8.5% | 10,855,400 |
| Taiwan | 8.4% | 17,523 |
| Malaysia | 8.2% | 16,042 |
| Poland | 7.3% | 46,544 |
| Indonesia | 7.2% | 17,325 |
| Ireland | 6.9% | 53,477 |
| Japan | 6.8% | 131,289 |
| Vietnam | 5.9% | 14,282 |
| Portugal | 4.7% | 126,300 |
| Germany | 4.3% | 407,675 |
| Israel | 4.2% | 22,585 |
| Netherlands | 4.1% | 191,135 |
| France | 3.9% | 394,201 |
| Italy | 3.9% | 169,488 |
| Spain | 3.4% | 469,023 |
| Denmark | 3.1% | 10,311 |
| United Kingdom | 3.0% | 1,727,225 |
Download the data (45 rows, one per country; gzipped CSV). It holds every number on the map, with no account, keyword or provider in it.
What each column means
- country
- Target country, ISO 3166 code
- judged
- SERPs since September 13 whose keyword has usual sites to be judged against
- degraded
- Of those, poisoned SERPs: fewer than half of the usual sites on any page, back on a later SERP
Western Europe ran lowest: the United Kingdom, Denmark, Spain, France, Italy, the Netherlands, Germany and Portugal were all under 5%. Their neighbors were not: Austria ran at 18.8%, Belgium at 13.2% and Switzerland at 12.8%, with Norway at 13.1%. South Africa (18.4%), the UAE (14.4%), New Zealand (13.8%) and Saudi Arabia (12.9%) complete the group above 12%.
It also depends on the route a request takes to Google. On the same days, from September 30 to October 9, one of the routes Nozzle collects through returned 1 to 7% poisoned SERPs and another 9 to 30%.
What kind of searches
- “Near me” searches more than most. 11.4% of them were poisoned, against 7.8% of everything else.
- The long tail more than the head. 9.4% for phrases searched fewer than 100 times a month, 6.1 to 7.1% above that.
- Brand searches least. 5.3% for the most navigational phrases, 6.6 to 9.0% for the rest.
- Local targeting makes no difference. City and postal-code SERPs look worse, at 8.4% and 10.7% against 7.8% for whole countries, only because they lean toward mobile and “near me”. The same phrase tracked nationally and locally, in the same country on the same device, comes out the same: 7.5% and 7.4% across 21,508 such pairs.
By industry
Each ridge is one industry’s US SERPs, day by day from August 20, all on one scale and ordered by the share poisoned since September 13; the grey ridge is every US SERP. Every industry peaked between September 27 and 29; what differs is how high. Legal SERPs reached 51.3% on September 27, pet SERPs 13.6% on September 28.
Share of US SERPs poisoned per day, by industry
Every ridge is on one scale: the tallest, legal SERPs on Sep 27, is 51.3%. Grey: every judged US SERP. Shaded: the baseline. Dashed: Sep 13, when requests to Google started failing, and Sep 20, when poisoned SERPs first appear. The numbers are the share since Sep 13, or on the day you point at.
Industry table
| Industry | Since Sep 13 | Worst day | Judged SERPs |
|---|---|---|---|
| Legal | 15.9% | 51.3%, Sep 27 | 30,338 |
| Home services | 12.7% | 48.4%, Sep 29 | 129,439 |
| Weddings | 11.6% | 45.5%, Sep 28 | 17,890 |
| Transportation | 11.0% | 46.2%, Sep 29 | 181,642 |
| Events and entertainment | 10.5% | 41.5%, Sep 29 | 60,274 |
| Travel and hospitality | 10.0% | 39.4%, Sep 28 | 146,561 |
| Insurance | 9.9% | 35.4%, Sep 27 | 55,089 |
| Finance and banking | 9.3% | 34.3%, Sep 29 | 182,394 |
| Telecom and internet | 8.9% | 33.9%, Sep 28 | 1,011,534 |
| Software and technology | 8.8% | 28.3%, Sep 27 | 178,092 |
| Education | 8.6% | 28.5%, Sep 28 | 35,274 |
| All US SERPs | 8.5% | 29.4%, Sep 29 | 10,855,400 |
| Jobs and careers | 8.2% | 31.5%, Sep 29 | 178,361 |
| Beauty and fashion | 7.6% | 34.2%, Sep 28 | 62,379 |
| Home and garden | 7.6% | 30.0%, Sep 28 | 392,753 |
| Health and medical | 7.5% | 26.4%, Sep 29 | 156,725 |
| Restaurants and food | 7.3% | 32.2%, Sep 29 | 159,718 |
| Retail and shopping | 7.2% | 25.7%, Sep 28 | 1,426,493 |
| Real estate | 6.8% | 28.1%, Sep 27 | 3,038,155 |
| Automotive | 5.3% | 23.0%, Sep 28 | 340,467 |
| Pets | 4.3% | 13.6%, Sep 28 | 25,240 |
Download the data (1,071 rows, one per day and industry; gzipped CSV). It holds every number in the chart, with no account, keyword or provider in it.
What each column means
- date
- Day the SERP was scheduled, UTC
- industry
- The keyword’s industry, or Unclassified
- judged
- US SERPs that day whose keyword has usual sites
- degraded
- Of those, poisoned SERPs: fewer than half of the usual sites on any page, back on a later SERP
Beyond the organic results
A poisoned SERP changes more than its organic results. For each part of the page, the chart compares a SERP with the keyword’s previous one: of the sites, questions or searches that part showed, how many it shows again.
What each part of the page keeps from the keyword’s previous SERP
- Baseline, Aug 20 to Sep 9
- Poisoned SERPs
Keeps less on poisoned SERPs
- Organic results88.5% → 20.7%
- People also search for87.9% → 30.7%
- People also ask87.4% → 46.9%
- AI Overview sources68.8% → 42.3%
- Local pack85.8% → 60.5%
- Image pack85.5% → 66.1%
- Discussions and forums90.9% → 74.3%
- Knowledge panel88.3% → 72.9%
- Video79.8% → 65.4%
- Shopping92.8% → 92.2%
Keeps more on poisoned SERPs
- Ads70.6% → 83.7%
Of the sites, questions, searches or businesses a part showed on the keyword’s previous SERP, the share it shows again, where both SERPs show that part. Each keyword’s poisoned SERPs against its own baseline, each keyword weighted by its poisoned SERPs.
Part table
| Part | Kept from the previous SERP | Shown on | ||||
|---|---|---|---|---|---|---|
| Baseline | Poisoned | Others since Sep 13 | Baseline | Poisoned | Others since Sep 13 | |
| Organic results | 88.5% | 20.7% | 75.5% | 100.0% | 100.0% | 100.0% |
| People also search for | 87.9% | 30.7% | 79.0% | 87.2% | 52.7% | 83.1% |
| People also ask | 87.4% | 46.9% | 73.5% | 87.9% | 80.8% | 85.9% |
| AI Overview sources | 68.8% | 42.3% | 62.8% | 54.2% | 34.9% | 55.2% |
| Local pack | 85.8% | 60.5% | 69.3% | 38.2% | 39.2% | 38.8% |
| Image pack | 85.5% | 66.1% | 79.9% | 23.0% | 44.2% | 24.8% |
| Discussions and forums | 90.9% | 74.3% | 89.3% | 20.5% | 27.0% | 21.1% |
| Knowledge panel | 88.3% | 72.9% | 81.1% | 4.1% | 4.7% | 4.9% |
| Video | 79.8% | 65.4% | 77.0% | 22.8% | 20.6% | 23.6% |
| Shopping | 92.8% | 92.2% | 94.9% | 14.3% | 14.6% | 14.8% |
| Ads | 70.6% | 83.7% | 71.9% | 9.2% | 8.6% | 8.5% |
Download the data (11 rows, one per part of the page; gzipped CSV). It holds every number in the chart and the table, with no account, keyword or provider in it.
What each column means
- part
- The part of the page
- kept_baseline_pct
- Of the sites, questions, searches or businesses the part showed on the keyword’s previous SERP, the share it shows again, where both SERPs show the part: baseline SERPs, August 20 to September 9
- kept_degraded_pct
- The same for poisoned SERPs since September 13, each against the keyword’s previous SERP
- kept_other_pct
- The same for the same keywords’ other SERPs since September 13
- shown_baseline_pct
- Share of baseline SERPs showing the part
- shown_degraded_pct
- Share of poisoned SERPs showing the part
- shown_other_pct
- Share of the same keywords’ other SERPs since September 13 showing the part
The organic results keep 20.7% of the previous SERP’s sites on a poisoned SERP, against 88.5% in the baseline, and “People also search for” keeps 30.7% of its searches, against 87.9%. Only the parts advertisers pay for hold steady: shopping keeps 92.2%, against 92.8%, and ads keep more than usual, 83.7% against 70.6%. What is shown changes too: the AI Overview appears on 34.9% of poisoned SERPs against 54.2% in the baseline, and “People also search for” on 52.7% against 87.2%, while image packs nearly double, 44.2% against 23.0%, and forum blocks rise from 20.5% to 27.0%. On desktop keywords that usually run to page 8 or beyond, 50.9% of poisoned SERPs stop at page 4 or earlier and 10.9% show no page numbers at all, against 0.2% and under 0.1% in the baseline.
What it does to tracked sites
For keywords where a project’s own site is one of the usual sites, that site was out of the top 10 on 58.6% of poisoned SERPs, against 2.7% in the baseline and 10.2% on the same keywords’ other SERPs since September 13. If a tracked site fell out of the top 10 for a day in late September and came straight back, this is the likely reason.
How long it lasts
Most spells of poisoning are a single SERP: 80% last one, 15% two and 5% three or more. The next SERP has the usual sites back 55.9% of the time, and 77.9% are back within three days, two days at the median.
How to tell it from a real ranking change
- The page is complete. No error, no captcha, the same template, the same build of Google’s frontend as a normal page. Nothing in the HTML marks it.
- The result set does not match the keyword’s history. Comparing against yesterday alone is fragile, because yesterday may have been poisoned too. Comparing against the keyword’s usual page-1 sites over the previous weeks separates a data problem from a ranking drop.
- It does not last. Four in five spells of poisoning are a single SERP, and most are back within three days. A real ranking change stays.
- Poisoned pages are thinner on average. An AI Overview and “People also search for” less often, more image packs and social sites, shallower pagination. None of that is reliable on its own.
- Search Console disagrees. If a site “disappears” and Search Console still shows impressions and clicks, nothing happened to the site.
Method
The study draws on a representative sample of the SERPs Nozzle collected from August 20 to October 9, 2026, across countries, devices, industries and location targeting. SERPs with no organic results are left out, since there is nothing to compare. A keyword’s usual sites are the sites in its top 10 on at least 60% of its SERPs from August 20 to September 9, the baseline, for keywords with five SERPs or more there; only those keywords’ SERPs are judged.
A SERP is poisoned when fewer than half of its keyword’s usual sites appear on any of its pages, and at least 80% of them are back on a later SERP within 14 days, or most of the sites missing from the previous SERP are back within three days. Back within three days counts the poisoned SERPs followed by another SERP of the keyword within three days. Sites gone are the previous SERP’s top-10 sites, from a SERP of the same keyword no more than 48 hours earlier, absent from every page. Short pagination is a desktop page 1 whose page numbers stop at 4 or earlier, or that shows none, on a keyword whose baseline ran to page 8 or beyond.
Comparisons of poisoned SERPs with other SERPs compare each keyword with itself and weigh it by its poisoned SERPs. What a part of the page keeps is the share of its items on the keyword’s previous SERP, such as sites or questions, that it shows again, counted where both SERPs show the part and the previous SERP, no more than 48 hours earlier, was not poisoned itself.
Each image renders Nozzle’s stored page-1 HTML of a SERP in Chrome with Google’s external scripts blocked, so it shows the page as Google’s server sent it, AI Overview included; a few lazy-loaded images do not load. The sites shown are Google’s results for these queries, not Nozzle customers. Site counts in the comparison are between the two SERPs shown.