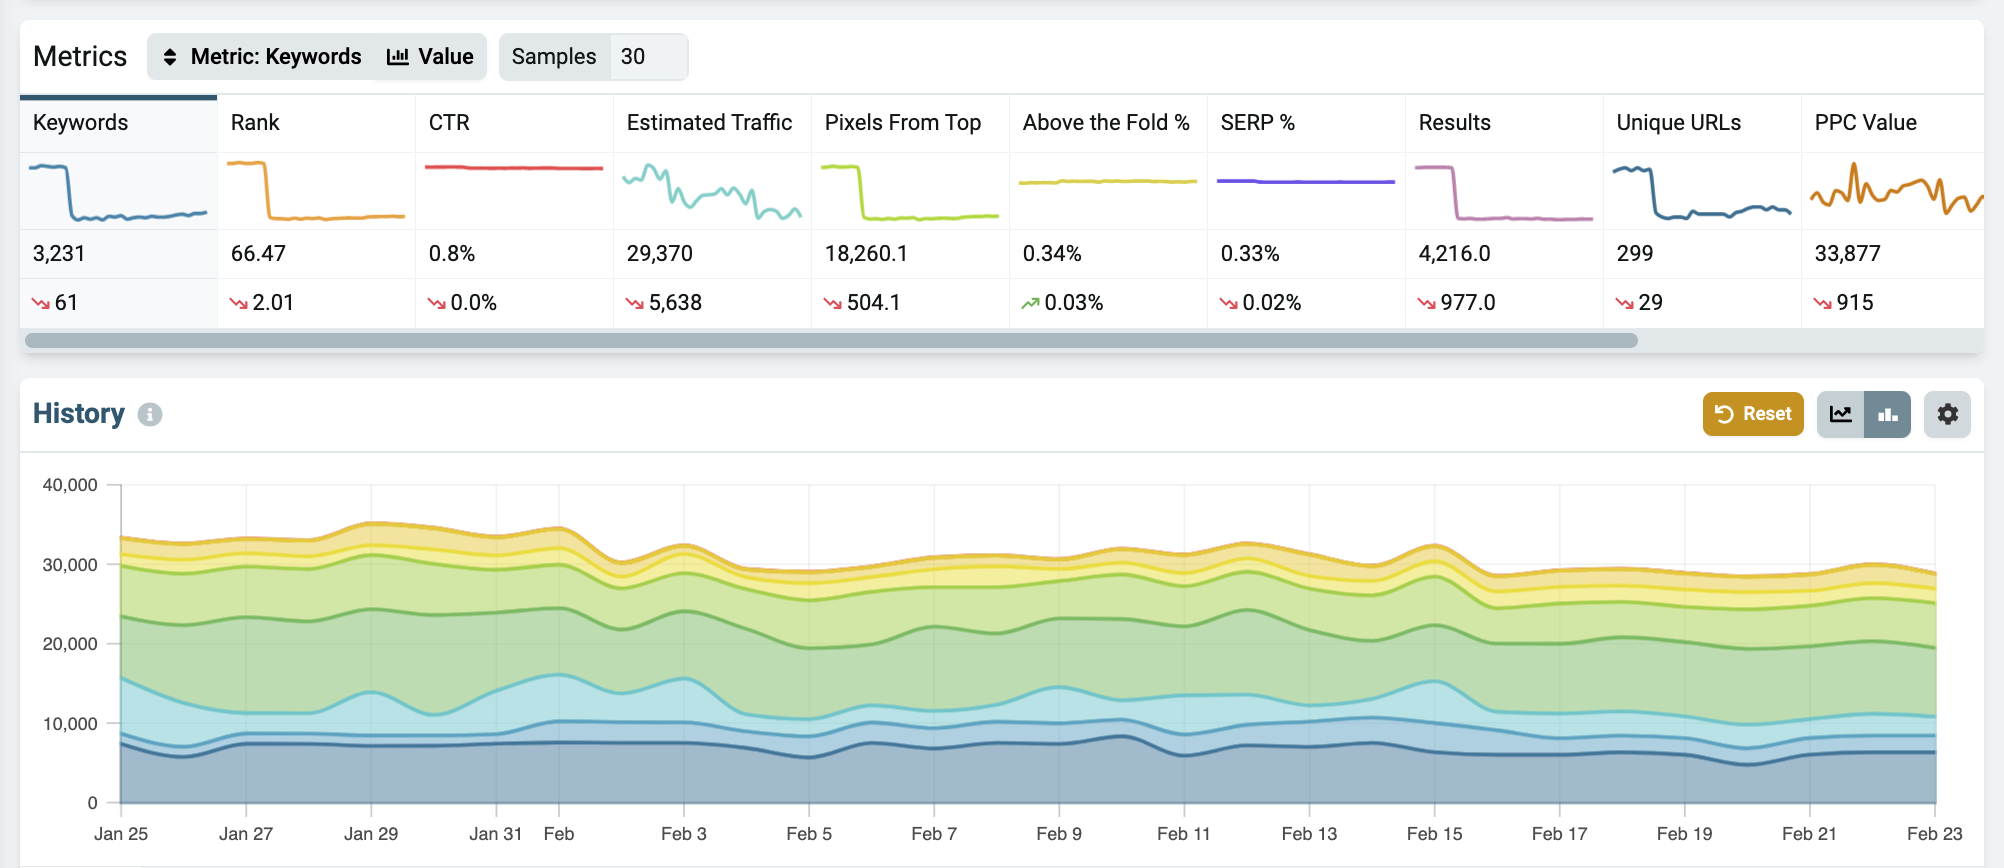
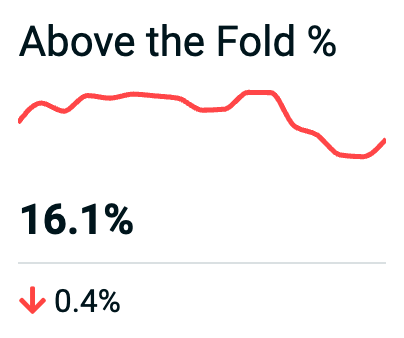
This is the percentage of SERP real estate you own above the fold in terms of pixel coverage. When applied to a group of keywords, it’s the average Above the Fold % of the whole group.
Since we render the SERP and measure the height and width of each result, we’re able to calculate the percentage of pixel coverage each result has per SERP. We also take into account the pixel coverage of all the white space surrounding each listing.
For Above the Fold %, we render a common resolution for desktop and mobile, then measure what pixels are visible without scrolling to calculate the percentage.
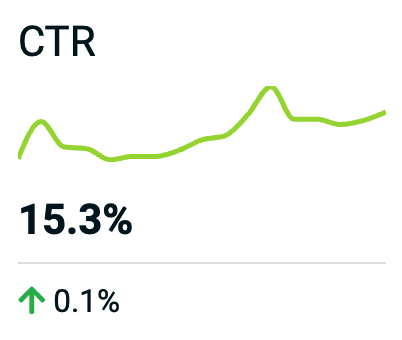
Click-Through Rate (CTR)
Our Click-Through Rate calculation starts with a base CTR curve unique to each device type based off of recent research and clickstream data. Then we look at SERP position, type of SERP feature, and surrounding features that appear within each specific SERP to estimate each results CTR.
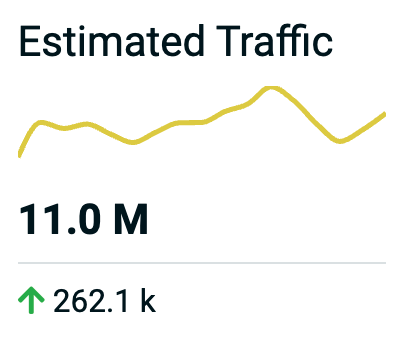
Read MoreEstimated Traffic
An estimate of monthly search traffic to each domain based on monthly search volume and per SERP click through rates. It is summed across however many results appear in the same SERP for each domain.
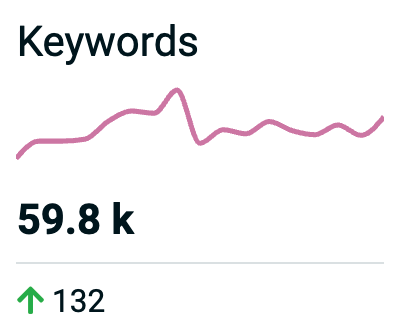
Read MoreKeywords
This is a count of how many unique keywords each domain ranks at least once for in the top 100 by default. You can filter down and only show top 10 or 20 results for example.
Read MorePPC Value
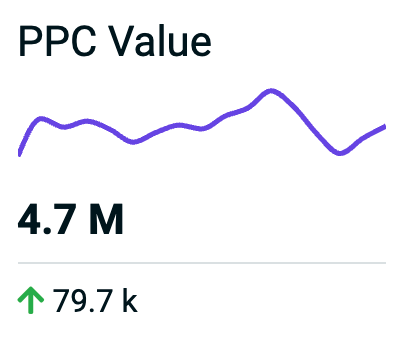
An estimate of the amount of money you would have to spend on PPC ads to get the same search traffic calculated by Estimated Traffic * Cost Per Click.
Read MorePixels from Top
Pixels from Top is the average pixel distance from the top of the SERP to the highest ranking result. If you rank multiple times for the same search, we only return the best measurement, since you shouldn’t be penalized for multiple listings.
To correctly aggregate across SERPs where you don’t rank, we use 30,000 pixels to average into your results, to remove noise for sites that only rank well for one or two keywords.
Rank
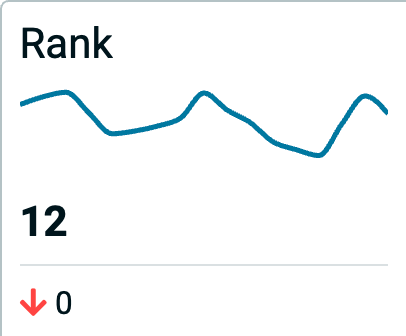
This is the average rank for the top ranking result on each SERP. We don’t average all ranks, because we don’t want to penalize your average ranking because you happen to rank in positions 1, 3, and 25 for the same SERP.
It’s also important to average correctly across SERPs where you may not rank. Since we track the top 100 results, we use 101 as the average rank so that a site that only ranks in position 5 for a couple SERPs out of thousands that you track doesn’t show up as being one of the top ranking.
In the Keyword Table, sometimes there is a gray number in the rank column. This is Item Rank, which shows where you’re positioned within a pack or a specific SERP feature (e.g. local, product, image packs, etc…)
Results
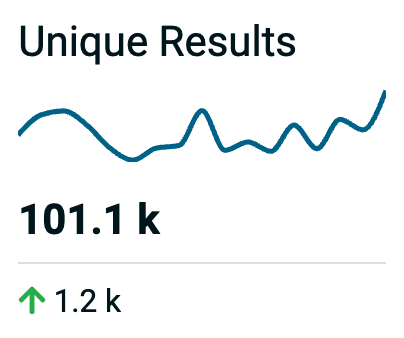
This is a count of how many individual results appear for each domain. Any link on the SERP, no matter how small, represents a result. So if your organic result contains two additional sitelinks and you also rank an image in an image pack for one search query, that would be 4 Unique Results.
Read MoreSERP %
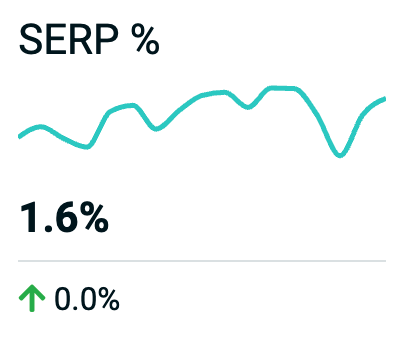
This is the percentage of SERP real estate you own in terms of pixel coverage. When applied to a group of keywords, it’s the average SERP % of the whole group.
Since we render the SERP and measure the height and width of each result, we’re able to calculate the percentage of pixel coverage each result has per SERP. We also take into account the pixel coverage of all the white space surrounding each listing.
SERP % is the pixel coverage of each result compared to the pixel coverage of all results on a SERP, unweighted for position.
Base Rank
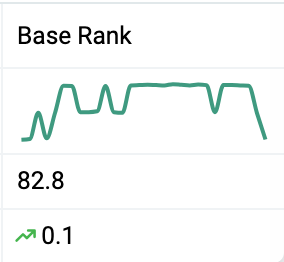
This only counts traditional organic results and featured snippets and ignores other SERP features like People Also Ask boxes, for example.
Read MoreSearch Volume
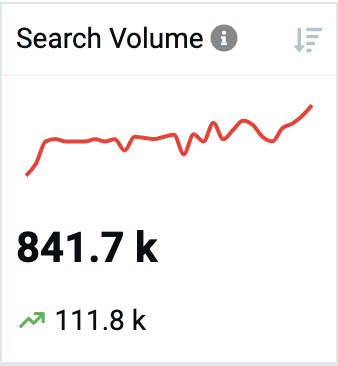
This indicates the monthly sum of searches on the keyword and location that you are tracking. The data is pulled from Google Keyword Planner.
Read More