Digital marketing strategies require studying and analyzing immense amounts of data. It is practically impossible to work with the unlimited data provided by the internet.
Then, how do you work with this large amount of data?
Google Data Studio is the answer.
What Can You Do with Data Studio?
Google Data Studio is a business intelligence tool for converting the data into an easy-to-read, easy-to-analyze format. It helps you to visualize your data by converting it into diverse charts, tables, and maps. It will connect to different data sources and allow you to share and collaborate with your team. This will ease the process of report generation.
- Visualize Your Data: It allows you to transform an infinite amount of data into user-friendly data stories. You can build interactive reports and customize them. The beautiful and user-friendly dashboard will help you do so in less time.
- Connect To Your Data: Data studio has built-in and partner connectors. These connectors help you to connect virtually to any data. It allows you to report data from various sources like Google Ads, Analytics, and Search Ads 360. It can also connect you to various data sources, such as consumer products like Search Console and YouTube, databases like MySQL, and social media platforms.
- Share Your Data: You can share your reports and dashboards with your teams or the world. You can also invite others to see, edit, and review your reports. This collaboration can take place in real-time.
Data Source Overview
As mentioned, you can derive and connect data from different data sources to generate consolidated reports. The data sources use connectors to fetch data from diverse platforms. You can choose from 500+ sources that also include Google owned tools and partners and other sources. Some of the Google Data Studio data sources include:
- Google Sheets
- Google Ads
- Analytics
- Google Search Console
- Amazon Ads
- Google My Business
- Binge Ads
- Facebook ads
- YouTube analytics
- Ahrefs
- Mailchimp
- Hubspot
- SEMRush
- Shopify
The data from these data sources are not imported into Data Studio. They maintain a live connection with your data. This helps companies with their strategy and decision making to help achieve their goals.
Connect Google Data Studio to Google Ads
Google Ads help you to reach potential customers using online ads. The data studio gets access to Google Ad advertisers and investigates the performance of these ads. Google Ads users with MCC accounts can connect and report on 50 sub-accounts per data source. The Data Studio Website lets you add Google Ads as data sources. Also, use the information while making reports.
A Step-By-Step Guide to Using Google Data Studio:
Google Data Studio is a simple and intuitive data tool for data visualization and strategy making. The visualization of data into graphs and tables, connecting the data to different data sources, and sharing it with the team and world are some of the tasks accomplished by Google Data Studio.
Now let us see how to use this interactive tool to make user-friendly, easy-to-analyze dashboards and reports.
Step 1: Create an account and access Google Data Studio
The very first step to access Google Data Studio is to create a Google account.
- Go to the Google Account Creation Page.
- Follow the steps gradually to create an account.
- Use the account details to sign in to your account.
After creating a Google account, log into Google Data Studio’s website.
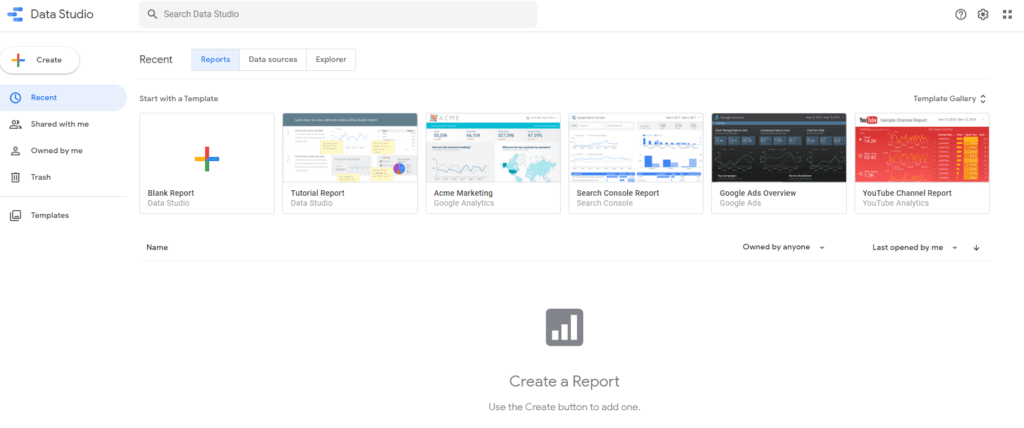
This is how the Data Studio site will appear when you first access it.
- The menu on the left lets you navigate between the reports that were shared with you or created by you. You can also get access to built-in templates from the left menu.
- The top menu allows you to smoothly navigate between reports, data sources, and explorers.
- The drop-down menu in the right-hand corner allows you to navigate between the data studio and Google Ad analytics.
Google Data Studio is a free tool as a part of Google’s Cloud platform offering. Hence, it does not require any payment to access it to make a dashboard and generate reports.
Step 2: Connect Data Sources
When you start accessing the Google Data Studio, the next thing you will want to do is start creating reports. But, first, connect to the data sources.
Data sources provide you with the data to generate reports. Follow the below steps to connect the data sources:
- Sign-in into your account.
- Select the ‘Create’ option on the top left corner.
- A dropdown menu opens, select ‘Data Source’.
- It takes you to the next screen, where you can select the data source you want to integrate with your report. Follow the steps provided to select the data source for your report. You can use the upper tab to name the data source.
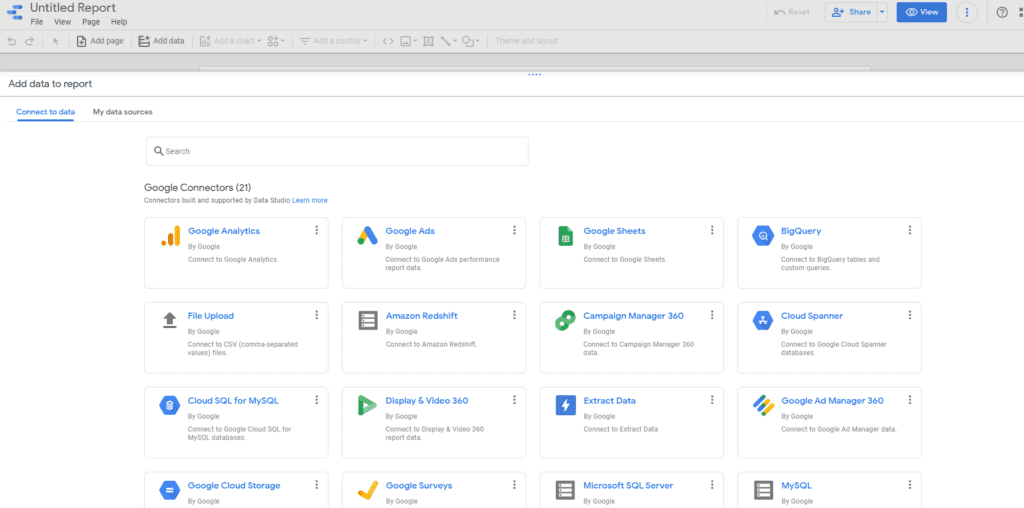
For instance, let us consider the data source of your preference as Google Sheets. After you click ‘Authorize’, Google Data Studio connects with the properties linked to your Google account. You can then select the spreadsheets and data you want for your report. After authorization, you now have a data source registered on Google Data Studio from where you can either create reports or explore the data in Explorer. You can either add data from the existing data sources or create a new data source.
Step 3: Create A New Report
Once you have created a data source you can create a new report in the Data Studio.
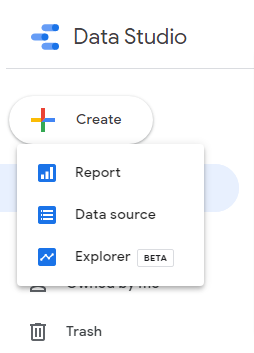
- Click on the ‘Create’ on the top left corner and select ‘Report’.
- You will then see the ‘Add data to report’ option with two tabs, ‘Connect to data’ or ‘My data sources’: -With ‘Connect to Data’ you can select a connector to the data resource and create a new data resource. -With ‘My Data sources’ you can add the data from the data sources you have created.
- Then, a table appears with fields from the selected data resources. You can change the data and style using the ‘properties panel’.
- You can add graphics, shapes, change the layout and customize the report according to your wishes.
- In the top left corner, add a name to your report by clicking on ‘Untitled report’
Whenever required, you can add more data to your report by selecting the ‘Add Data’ option, in the toolbar.
Step 4: Add Charts To Your Report
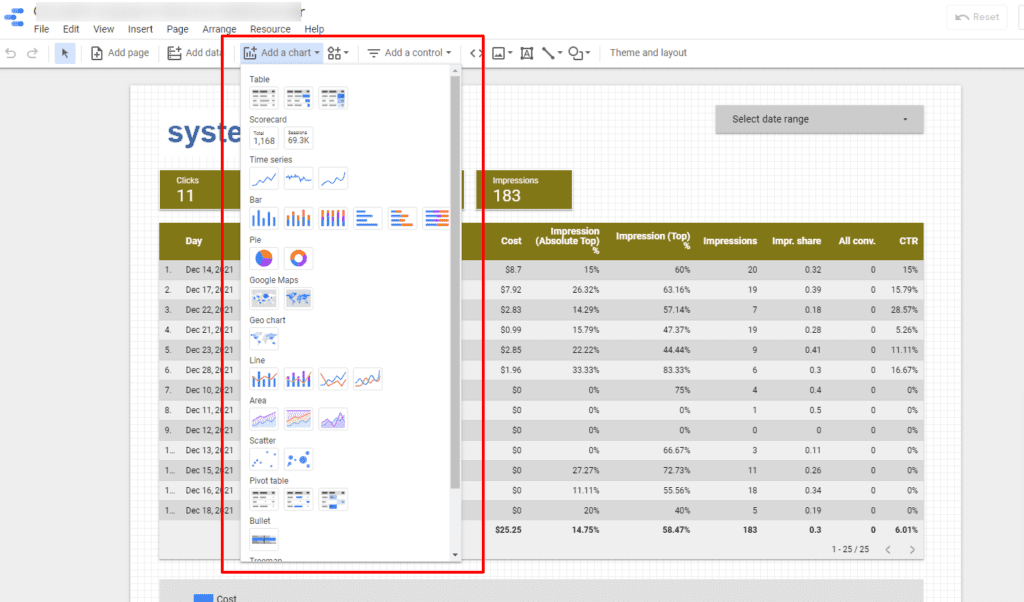
Data visualization makes the data visually appealing and user-friendly to access and analyze. It helps in making effective strategies for the future. In the Google Data studio, charts, tables, and maps help in data visualization.
Follow the below steps to add charts to your report:
- Navigate to the page of the report which will contain the chart.
- Select the ‘Add a chart’ option in the toolbar.
- Select the chart you wish to add.
- Click on the canvas to add the chart to report.
- Add more charts if needed.
- Resize them as per your requirement.
Steps to add a Pie chart:
- Following the above steps; add a Pie chart to the report.
- From the properties panel on the right select ‘Data’
- Select ‘User’ type dimension from ‘Dimension Picker’ in ‘Source’ Dimension chip
- Gradually following the steps you can adjust and customize the pie chart according to your preference.
Following similar steps, you can also add other types of charts to your report.
Step 5: View and Share Your Report
When you have created the report, added charts, and customized it you will now wish to share it with your teammates, or the world. Data Studio makes it easy for others to view and collaborate on the reports. In the following step, we have shown how you can view and share your report:
View your report:
- To view your report as the others would see it, click on the VIEW option in the right corner.
- If you wish to edit something in the report, you can select ‘Edit’ to return to the editing page.
Share your report:
- To share your report, click on the ‘Share’ option in the upper right corner.
- You can specify individual email addresses to share the report or also directly add the Google groups.
- You can also restrict them to only viewing the report by selecting the ‘Only View’ option.
- For collaboration, you can add collaborators’ email addresses through sharing.
Conclusion
Google Data Studio is proving itself to be an empirical tool for companies to analyze unlimited data. It allows users to generate interactive and user-friendly reports for better strategy making. In the Google Data Studio guide, we learned how to use and create reports in Google Data Studio. It is an easy-to-use tool with a clear UI.
Google Data Studio is actively helping digital marketers in developing planned future strategies.
So, what are you waiting for?
Go and create beautiful data reports for effective decision-making for your company.
