Landing Pages Dashboard
You can use this dashboard to drill down to specific URLs and get data on their performance.
The Landing Pages dashboard is for analyzing the individual performance of a given URL for your keywords.
This does not have to be your own URLs. Nozzle collects data on every URL that appears in the top 5 pages (50-60 results) for your keywords, so you can track your competition - or discover your competition - with this dashboard.
Use the Focus dropdown to select your desired brand or brand type. You may also filter by segment, keyword group, and date range.
Select any URLs you want to examine using the Filter Landing Pages search bar. Leaving it empty will show you data for all the pages of your selected focus.

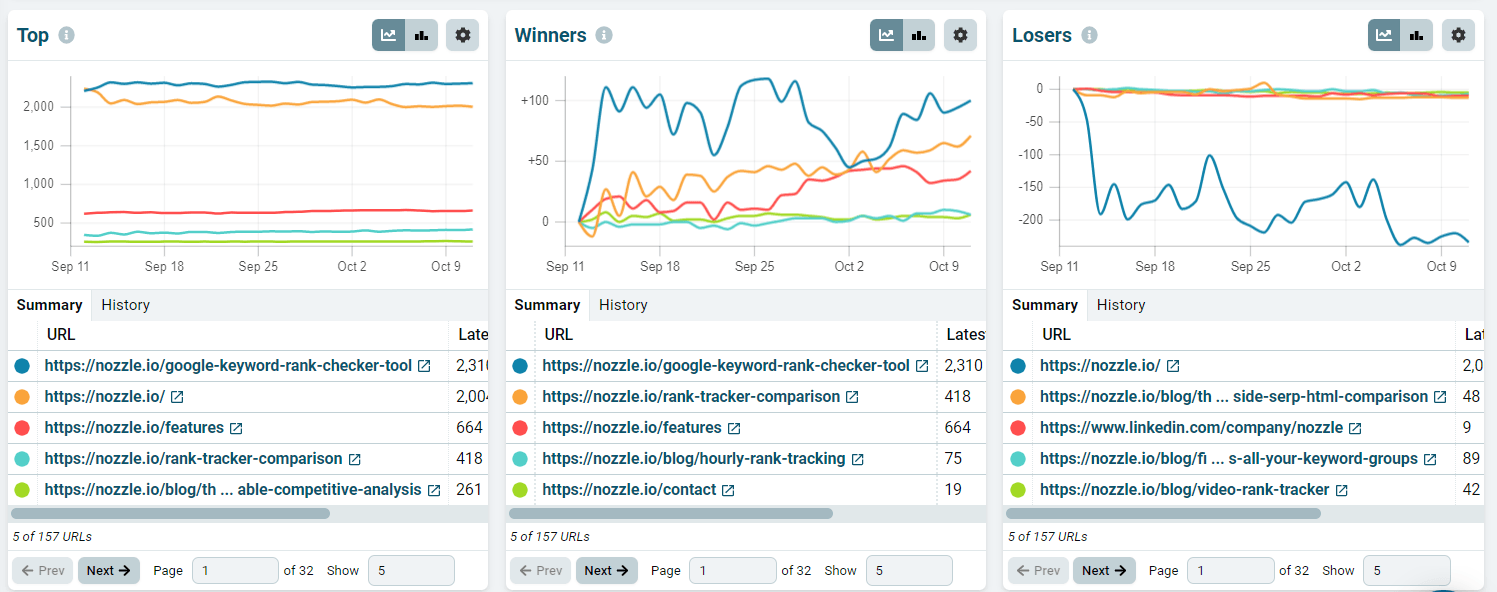
Below that, you'll see the Top, Winners, and Losers graphs and tables. This is a quick look at which URLs are performing the best, which have had the most increases, and which have fallen the most.
Use this information to spot potential problems - and fully expected wins - for specific pages.
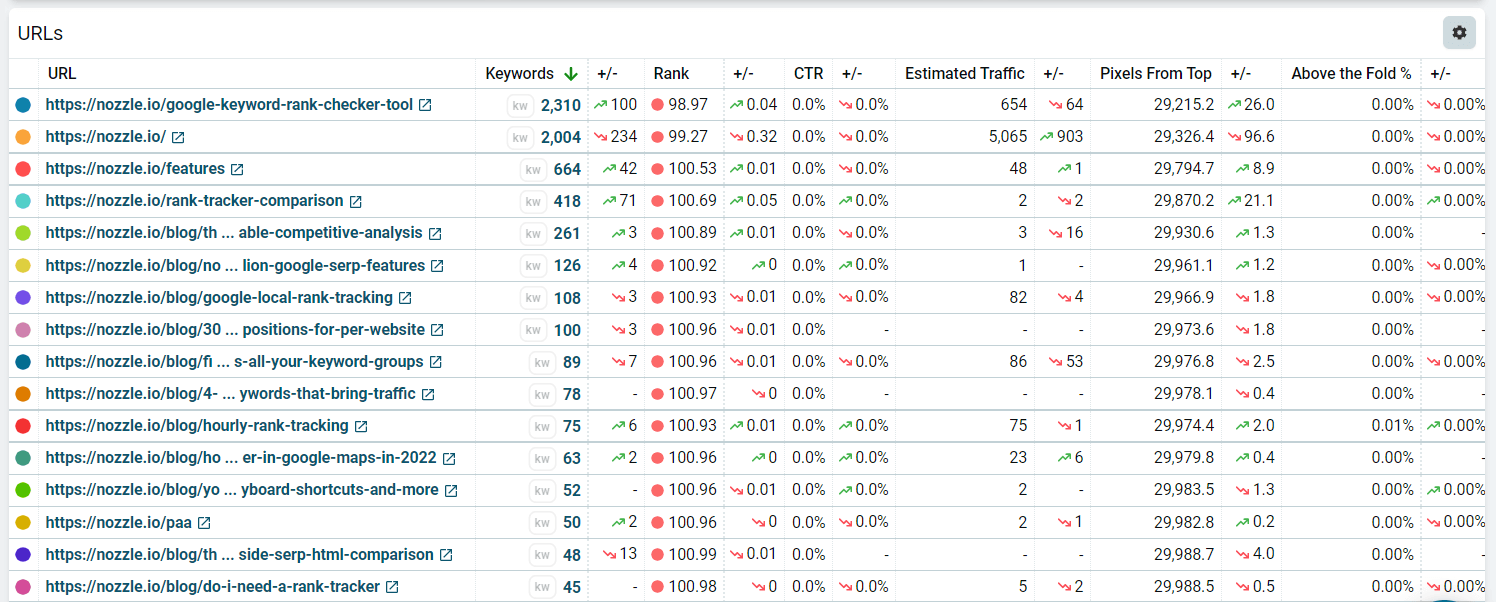
Further down, you'll find the same data in the Landing Pages table. You can sort this data by the different columns to find the pages that have the most estimated traffic or which ones appear the most for your keywords.
For more information about Nozzle dashboards, click here.
Related articles