Performance - Single Keyword Dashboard
Get all the details on individual keywords and see the SERP for yourself.
The Performance - Single Keyword dashboard is for analyzing a single key phrase, its history, and the SERP environment that surrounds it.
If you click a keyword in any of the charts on any of the other dashboards, you will end up on this page where it will be populated with all the data for that term.
Alternatively, if you start out on this dashboard, simply select a brand or domain using the Focus dropdown, then choose the specific keyword in the Keyword dropdown.
Be sure the date range is set to the period you want to examine.

Scrolling down, you'll find a history chart with metric tabs for the keyword you selected.

Below, you'll see the SERP Results table which shows the Result Type, URL, Displayed Title, Rank, and several other metrics for the SERP.
This provides a big-picture/overall view of the SERP.
This table is showing, by default, one entry per rank, but you can change that by clicking Expand Items.
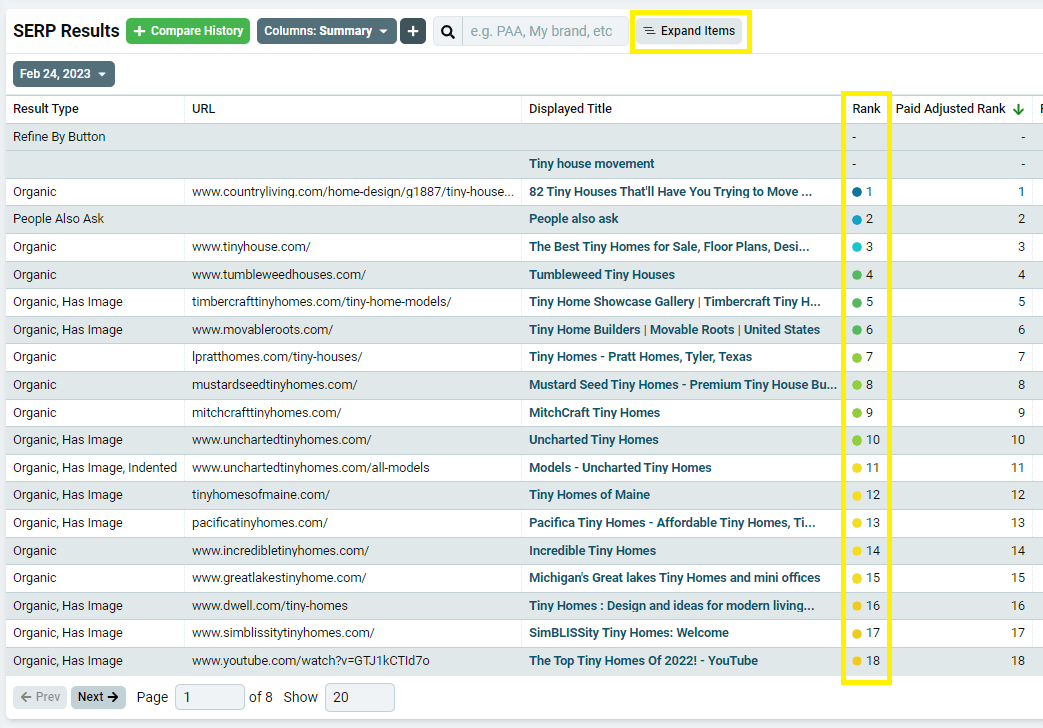
This will show you how certain result types, like People Also Ask boxes and site links, are actually impacting the top of the SERP.
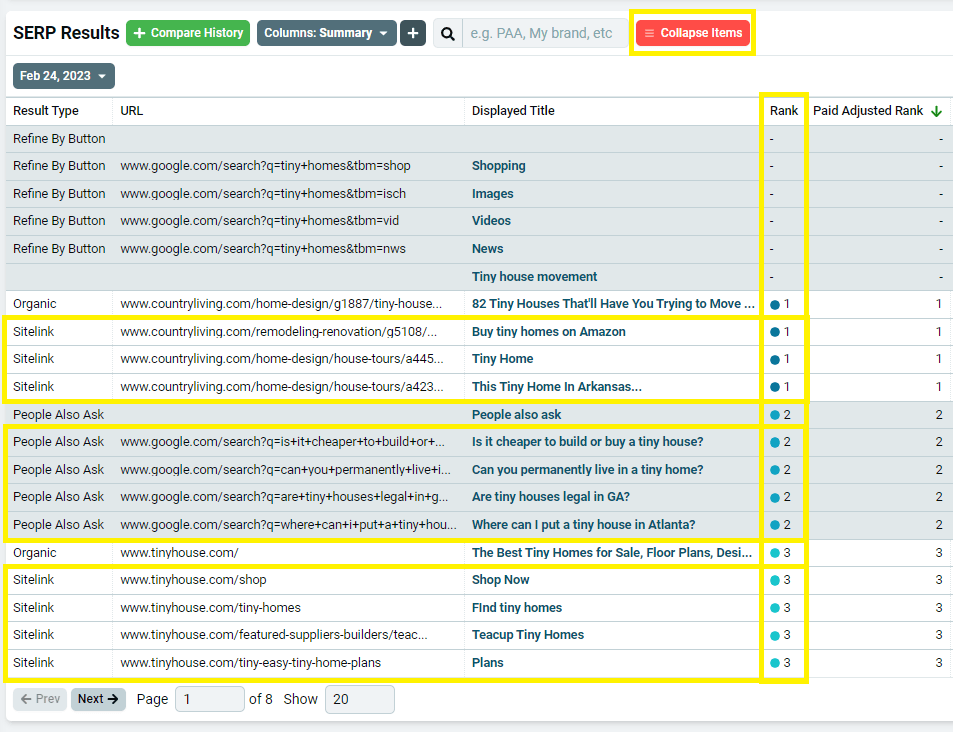
This is showing results for your selected keyword on your selected date, but you can use the Compare History buttons and the date dropdowns to compare SERP results and HTML from multiple days within the selected range.

Finally, the SERP Snapshot displays the SERP for your keyword as it appeared on Google on the selected date (or dates - you can use the Compare History button here, too). This is not just a screenshot. We capture the HTML for the entire SERP and keep it available for you to analyze any time in the future.
This where you can look at your results through our Nozzle Vision – a visual representation of how our system sees and labels everything on the SERP.
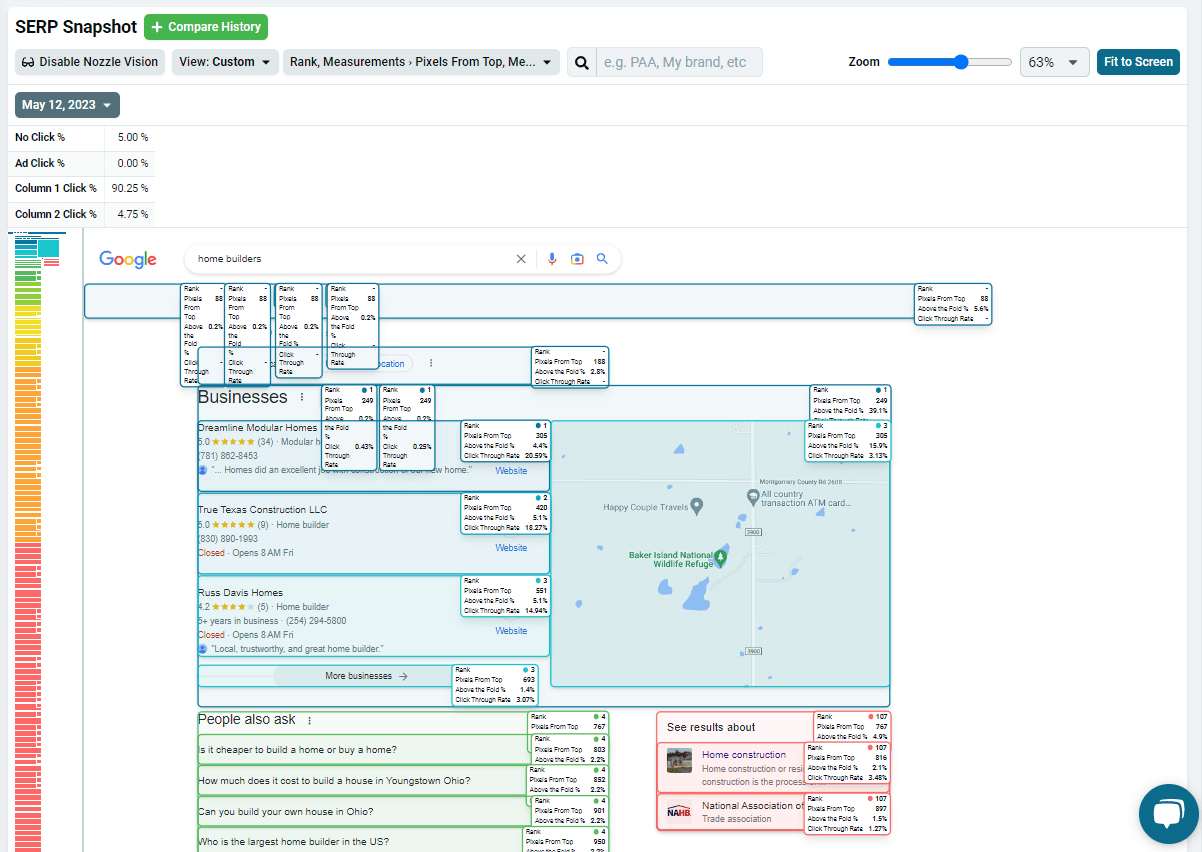
Both the Snapshot and the Results have several options for deeper analysis and comparison.
You can choose the metrics you want to examine in the SERP Results table and Nozzle-Vision-enhanced Snapshot with the + Add Columns and View dropdowns.
The View dropdown allows you to choose some preset groupings of metrics, like Pixels, or Ranks, so you can quickly dive into a specific subset.
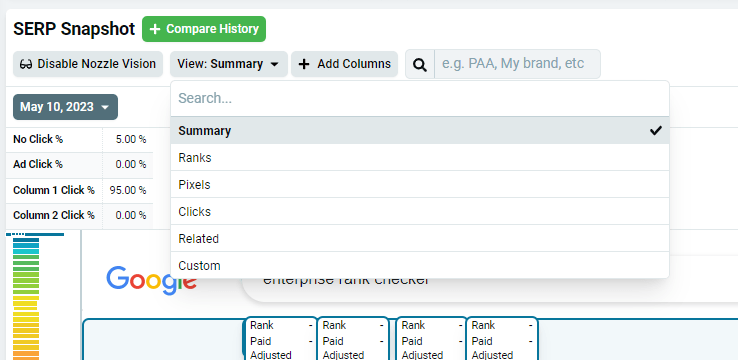
The Add Columns menu is the one to use if you want to chose one or more metrics yourself. There are a ton of options in here, so be aware that the more you include, the more crowded Nozzle Vision will become.
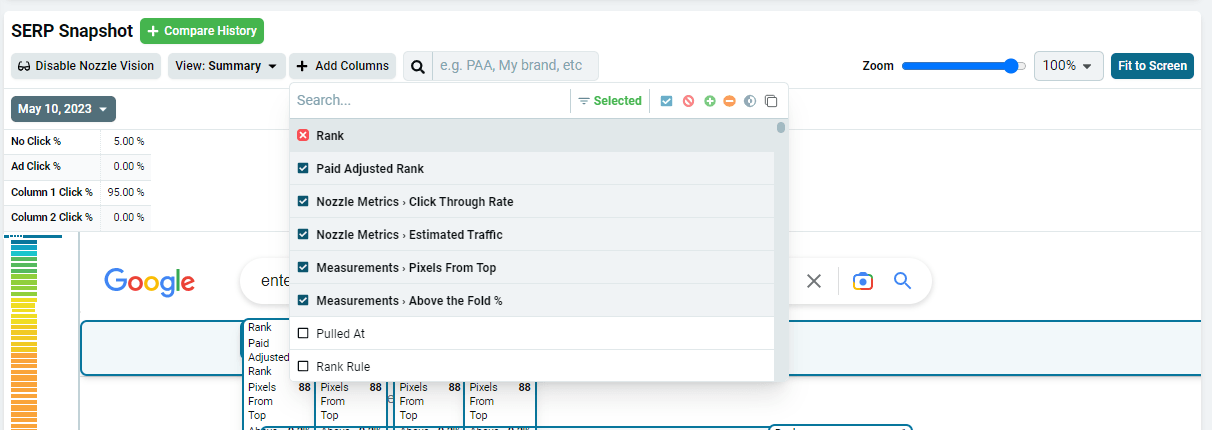
The quickest way to find the specific item you want to examine is to use the search bar next to the columns button.
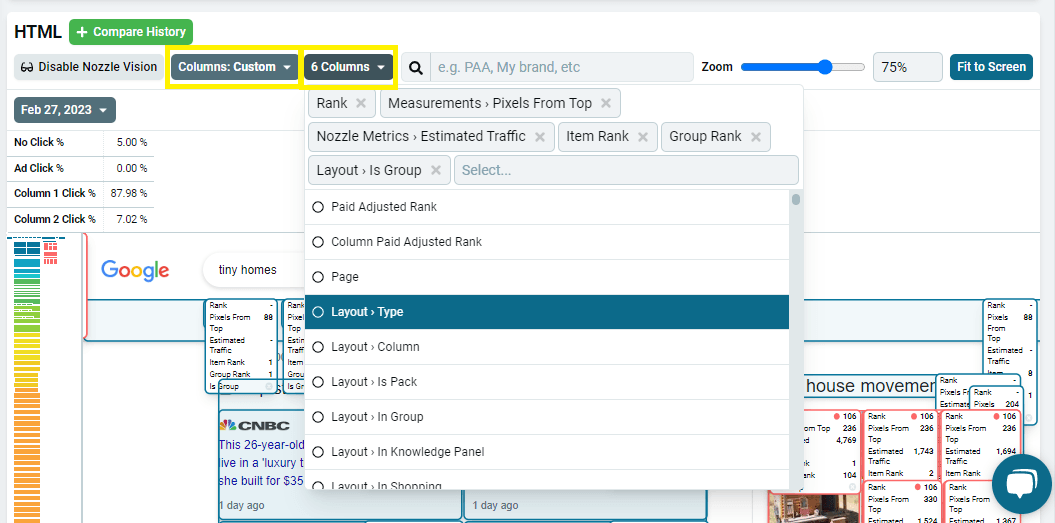
You can use the Zoom controls let you resize the snapshot so you can more of the SERP, or you can use the Fit to Screen button to quickly resize the image.
The options in Nozzle Vision can also be very helpful in preparing progress reports for your boss or clients to show that your efforts are making a difference.
For more information about Nozzle dashboards, click here.
Related articles