Keyword Groups Dashboard
Once you've set up your keyword groups in Nozzle, you can use this dashboard to get some important data.
The Keyword Groups dashboard makes it easy to analyze your data by one or more keyword groups.
Use the Focus dropdown to select the Brand or Domain. You may also filter your results by Segment and date range.
Choose the metric you want to examine by clicking one of the tabs in the Metrics bar. The default metric is "Keywords", but you can look at Rank, CTR, and other metrics to see how an entire group is performing for it.

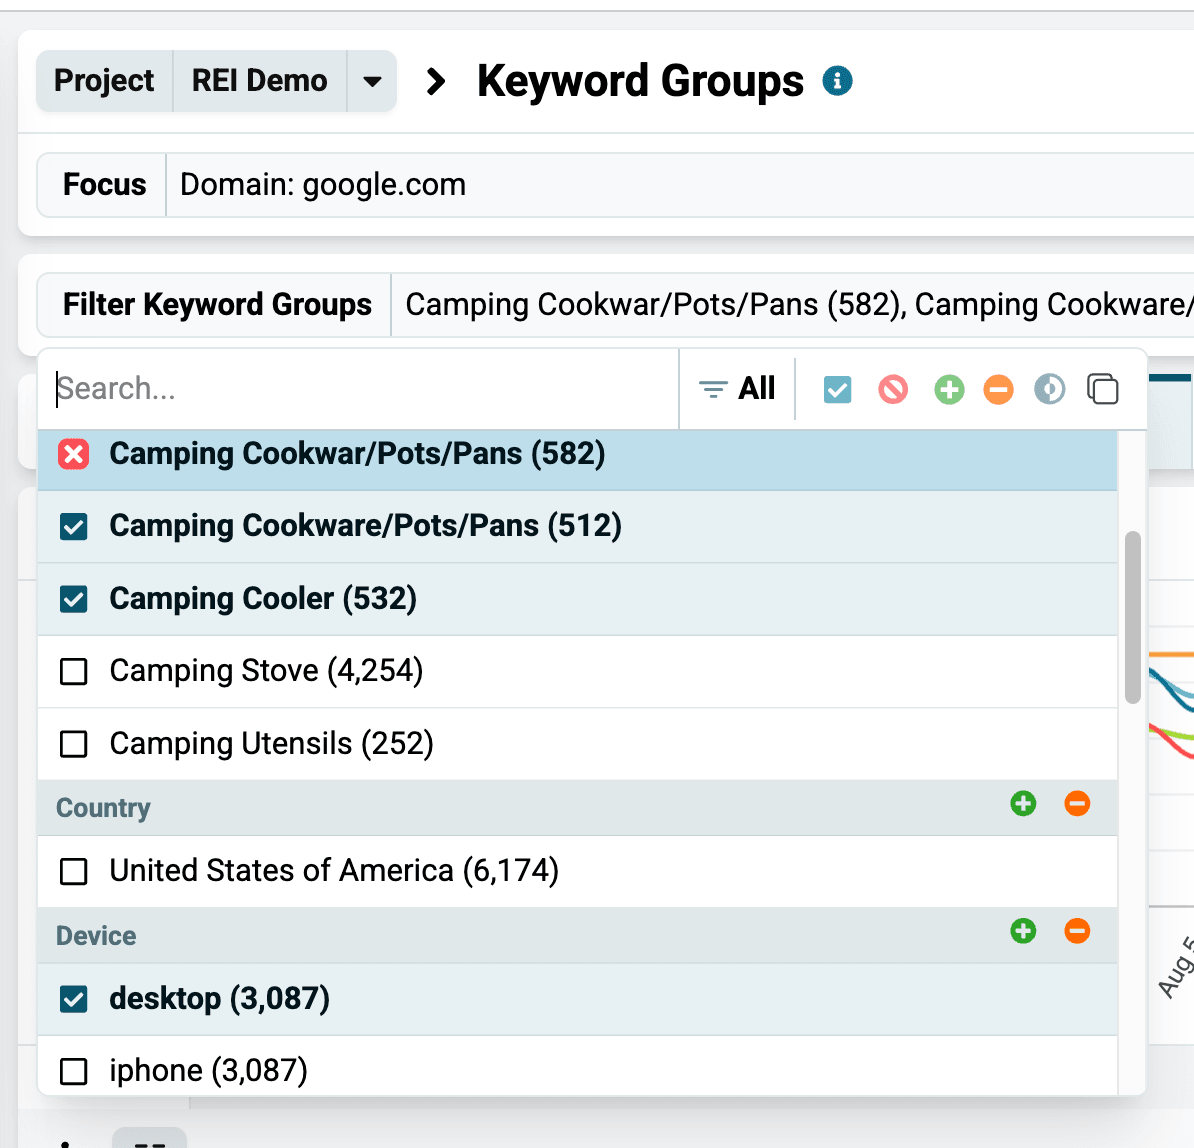
Use the Filter Keyword Groups dropdown to select custom and/or built-in keyword groups to analyze specifically. Leaving it empty will show you data for all your keyword groups.
The Summary chart below lets you toggle between the Top, Winners, and Losers tabs, so you can easily see which groups have been performing the best, which have had the most growth, and which have gone down the most.

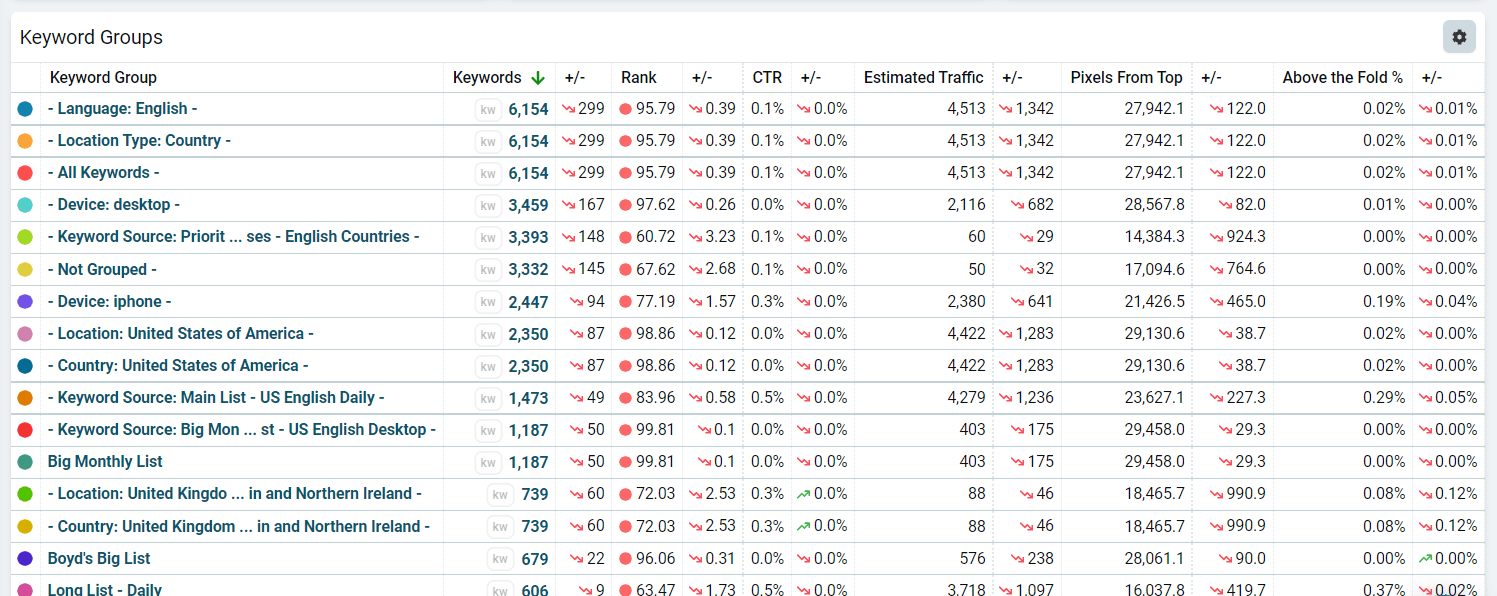
You can explore the same data in the Keyword Groups table at the bottom of the page. This is where you can sort the data by each metric to explore different facets of these groups.
For more information about Nozzle dashboards, click here.
Related articles